08 Dezember 2022

European Parliament seat projection (December 2022): S&D make significant gains, Liberals fall back


Left G/EFA S&D RE EPP ECR ID NI other
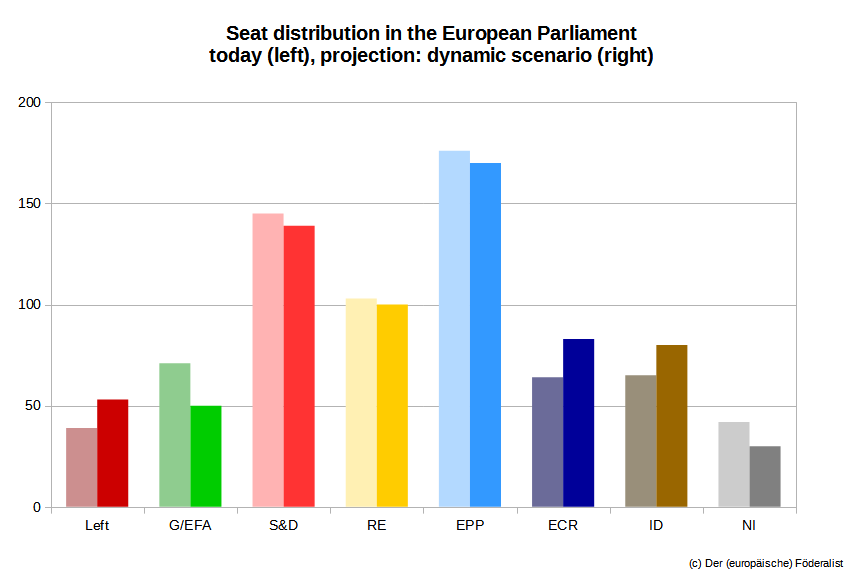
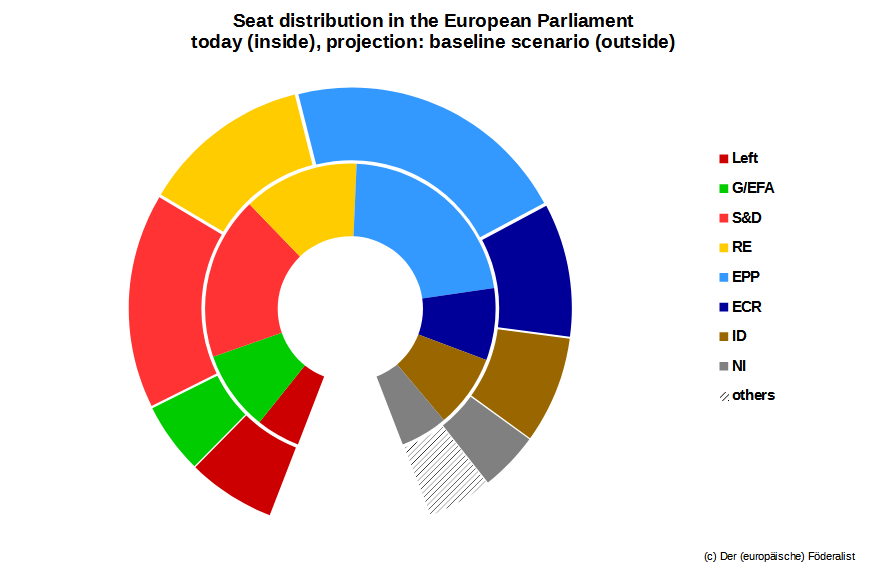
EP today3871146102176636445
Oct. 22524212710016979633538
Dec. 2251441369316679643735
dynamic535013910017083
8030
Baseline scenario,
as of 06/12/2022.


Dynamic scenario,
as of 06/12/2022.

If you are a regular follower of the European Parliament seat projections on this blog, you will already be familiar with the phenomenon: If there is a sudden jump in the projection, that’s usually because some dramatic political developments have taken place within an individual member state – or because a new survey has been published in France. As French politics is so strongly focused on the person of the president, there are hardly any polls that ask about party political preferences outside the campaign period for parliamentary elections. When one does appear, as has now happened in early November for the first time in almost half a year, it often shows significant changes in the political mood. And since France is one of the largest member states, this of course also has a direct impact at the European level.

In the current case, the new French poll pushes the centre-left S&D group, which makes strong gains compared to the last European Parliament seat projection in October. In the national parliamentary election in June, the French PS had dropped so low that it no longer appeared in the seat projection. By contrast, the recent poll sees the party clearly above the national electoral threshold, which would add a significant number of seats to the S&D group. On the other hand, the Liberals, the Conservatives and the Left are falling back both in France and in the European Parliament seat projection.

S&D make strong gains

Still, France is not the only country where social democrats have performed well in recent weeks. S&D member parties also made some inroads in Germany, Spain, Hungary, Sweden, Denmark, and Lithuania.

Meanwhile, the Italian PD is still struggling over its future direction after being defeated in the national parliamentary election in September. Also in the Netherlands, Portugal, Austria and Croatia, social democratic parties suffered downturns in recent polls. Nevertheless, on balance the S&D have made significant gains and would now reach 136 seats (+9 compared to October).

EPP slightly down

The centre-right European People’s Party (EPP) recently improved its polling in Germany and Croatia, among other countries. The Latvian EPP member JV, which won the national parliamentary election in early October, further increased its lead in the first poll published since then.

However, Italy’s FI continues to plummet after joining the right-wing government around Giorgia Meloni (FdI/ECR), and Spain’s PP appears to be paying an electoral price for its blockade of the renewal of the national judiciary body. The polling numbers of the French, Portuguese, and Danish EPP member parties also deteriorated in recent weeks. In total, the group is down to 166 seats (–3).

Liberals with significant losses

Even more significant is the downturn of the liberal Renew Europe group (RE). Its member parties are suffering setbacks not only in France, but also in Germany and Poland. The Swedish Liberalerna, whose support for the country’s new right-wing government has recently caused some trouble in the RE, wouldn’t even enter the European Parliament now.

The only RE member that has improved its polling during the last weeks is the Danish LA. Similar to other centrist parties, it performed very well in the national parliamentary election in early November and can now hope to win a seat in the European Parliament, too. But for the RE group as a whole, this is not enough. In the projection, the Liberals falls back to 93 seats (–7), their worst figure in two years.

Greens gaining ground

Further to the left of the political spectrum, the European Greens (who recently held their party congress in Copenhagen, which takes place only once per electoral period) are among the winners of the last weeks. Although their traditional powerhouse, the German Greens, is not making much headway, the French and Dutch Greens have improved their polling – as have the Czech Piráti, who are also members of the Greens/EFA group. Altogether, the group now stands at 44 seats (+2).

The Left, on the other hand, has suffered significant losses in the new French poll, but has made some inroads in several other countries, such as the Netherlands, Greece and Portugal. All in all, the group remains almost unchanged at 51 seats (–1).

ECR: FdI still on the rise

On the other side of the hemicycle, the Italian FdI are rising ever further within the right-wing ECR group. After their national election victory in September, the party of the new head of government, Giorgia Meloni, continues to soar in the polls and would now be the second strongest single national party in the European Parliament – ahead of Emmanuel Macron’s government alliance Ensemble (RE) and only minimally behind the German CDU/CSU (EPP). In Romania, Sweden and Slovakia, on the other hand, ECR member parties have been polling slightly worse in recent weeks, leaving the group as a whole unchanged at 79 seats (±0).

For the other right-wing group, ID, the last weeks have brought little news. While the Portuguese Chega and the Austrian FPÖ are making further inroads (the latter of them being the strongest national force in some polls now), the French RN does slightly worse in the new poll than in the national parliamentary election in June. Overall, the ID group therefore increases its number of seats only minimally to 64 (+1).

Non-attached and “other” parties

With RN struggling, Éric Zemmour’s far-right party Reconquête is making a small comeback in France. The party, which was founded only a year ago, seemed to be on the verge of collapse after it failed miserably in the national presidential election in April and the parliamentary election in June. However, according to the new poll, it would now again pass the national five-percent threshold by a minimal margin. If this result holds until the next European election, Reconquête is set to further fill the ranks of non-attached MEPs.

Meanwhile, Hungary’s Fidesz and Greece’s KKE fared somewhat worse in the latest polls. As a consequence, the overall number of non-attached MEPs increases only slightly in the projection (37 seats / +2).

Finally, the “other” parties (which are currently not represented in the European Parliament and cannot be clearly assigned to any political group) experience slight losses. Among them is the Dutch agrarian party BBB, which had grown rapidly in the course of the farmers’ protests this summer but seems to have passed its zenith by now. All in all, the “other” parties account for 35 seats (–3) in the projection.

The overview

The following table breaks down the distribution of seats in the projection by individual national parties. The table follows the baseline scenario, in which national parties are each attributed to their current parliamentary group (or to the parliamentary group of their European political party) and parties without a clear attribution are labelled as “others”.

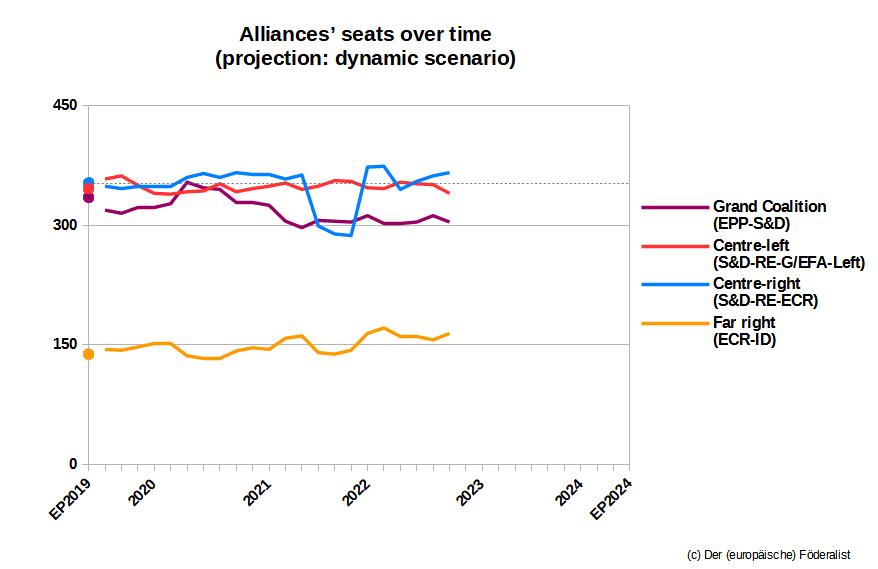
In contrast, the dynamic scenario of the seat projection assigns all “other” parties to the respective parliamentary group to which they are politically closest, and also includes possible other future group changes of individual national parties. In the table, the changes in the dynamic scenario compared with the baseline scenario are indicated by coloured font and by a note mouseover text.

In the absence of pan-European electoral polls, the projection is based on an aggregation of national polls and election results from all member states. The specific data basis for each country is explained in the small print below the table. More information on the European parties and the political groups in the European Parliament can be found here.


Left G/EFA S&D RE EPP ECR ID NI other
EP today3871146102176636445
Oct. 22524212710016979633538
Dec. 2251441369316679643735
dynamic535013910017083
8030

Left G/EFA S&D RE EPP ECR ID NI other
DE 5 Linke 18 Grüne
1 Piraten
1 ÖDP
1 Volt
18 SPD 6 FDP
2 FW
27 Union
1 Familie

13 AfD 2 Partei 1 Tier
FR 10 LFI 6 EELV 7 PS 23 Ens 10 LR
19 RN 4 Rec
IT

14 PD 6 Az-IV 7 FI
1 SVP
26 FdI 7 Lega 15 M5S
ES 7 UP
1 Bildu
1 ERC 17 PSOE 1 Cʼs
1 PNV
19 PP 10 Vox
1 JxC 1 MP
PL

5 Lewica 5 PL2050
16 KO
3 KP
20 PiS

3 Konf
RO

14 PSD 3 USR 9 PNL
2 UDMR
5 AUR


NL 2 PvdD
2 SP
3 GL
2 PvdA 5 VVD
3 D66
1 CDA
1 CU
2 JA21
1 SGP
4 PVV
3 BBB
EL 7 Syriza
3 PASOK
8 ND 1 EL
1 KKE 1 MeRA25
BE 3 PTB 1 Groen
1 Ecolo
2 Vooruit
2 PS
1 O-VLD
2 MR
1 CD&V
1 LE
1 CSP
3 N-VA 3 VB

PT 1 BE
1 CDU

8 PS 1 IL 7 PSD
3 CH

CZ
3 Piráti

8 ANO 1 STAN
1 TOP09
5 ODS 3 SPD
HU

4 DK
1 MSZP
1 MM 1 KDNP

12 Fidesz
2 MHM
SE 2 V 1 MP 8 S 1 C
4 M
1 KD
4 SD


AT
2 Grüne 5 SPÖ 2 Neos 4 ÖVP
6 FPÖ

BG

2 BSP 2 DPS 5 GERB
1 DSB


4 PP
2 V
1 BV
DK 1 Enhl. 1 SF 6 S 2 V
1 LA
1 K


1 DD
1 M
FI 1 Vas 1 Vihreät 3 SDP 2 Kesk 4 Kok
3 PS

SK

3 Smer-SSD 1 PS 2 OĽANO
1 Spolu
1 KDH
1 SaS 1 SR 1 REP 3 Hlas-SD
IE 6 SF

3 FF 4 FG


HR

2 SDP
6 HDZ


2 Možemo
1 Most
1 DP
LT
1 LVŽS 3 LSDP 1 LRLS
2 TS-LKD

1 DP 2 DSVL
1 LT
LV


3 JV
1 NA

1 ZZS
1 Prog
1 LRA
1 S!
SI

1 SD 4 GS 2 SDS
1 N.Si


EE


3 RE
1 KE


2 EKRE
1 E200
CY 2 AKEL
1 EDEK
3 DISY


LU
1 Gréng
1 PPLU
1 LSAP 1 DP 2 CSV


MT

4 PL
2 PN


Development (baseline scenario)


Left G/EFA S&D RE EPP ECR ID NI other
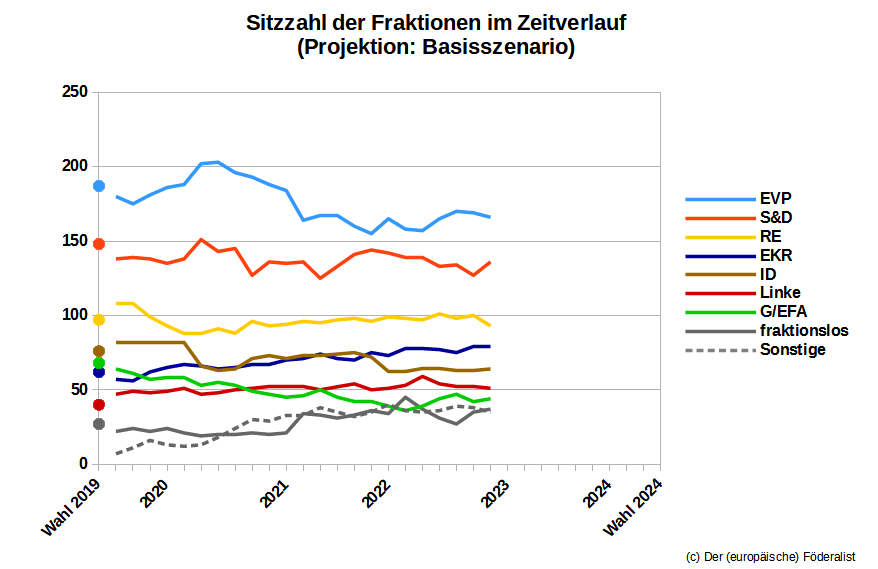
06/12/2022 51 44 136 93 166 79 64 37 35
12/10/2022 52 42 127 100 169 79 63 35 38
20/08/2022 52 47 134 98 170 75 63 27 39
22/06/2022 54 44 133 101 165 77 64 31 36
25/04/2022 59 39 139 97 157 78 64 38 34
01/03/2022 53 36 139 98 158 78 62 45 36
04/01/2022 51 39 142 99 165 73 62 34 40
08/11/2021 50 42 144 96 155 75 72 36 35
13/09/2021 54 42 141 98 160 70 75 33 32
21/07/2021 52 45 133 97 167 71 74 31 35
24/05/2021 50 50 125 95 167 74 73 33 38
29/03/2021 52 46 136 96 164 71 73 34 33
02/02/2021 52 45 135 94 184 70 71 21 33
09/12/2020 52 47 136 93 188 67 73 20 29
12/10/2020 51 49 127 96 193 67 71 21 30
14/08/2020 50 53 145 88 196 65 64 20 24
25/06/2020 48 55 143 91 203 64 63 20 18
26/04/2020 47 53 151 88 202 66 66 19 13
10/03/2020 51 58 138 88 188 67 82 21 12
09/01/2020 49 58 135 93 186 65 82 24 13
23/11/2019 48 57 138 99 181 62 82 22 16
23/09/2019 49 61 139 108 175 56 82 24 11
30/07/2019 47 64 138 108 180 57 82 22 7
EP 2019 40 68 148 97 187 62 76 27

The “EP 2019” line indicates the distribution of seats as of July 2, 2019, when the European Parliament was constituted following the election in May 2019.
The table shows the values of the baseline scenario without the United Kingdom. An overview of the values including the United Kingdom for the period up to January 2020 can be found here. An overview of older projections from the 2014-2019 electoral period is here.
The full names of the parliamentary groups and of the national parties appear as mouseover text when the mouse pointer is held motionless on the designation in the table for a short time. If a party is attributed to a different parliamentary group in the dynamic scenario than in the baseline scenario, this is also indicated in the mouseover text.

Attribution of national parties to parliamentary groups

Baseline scenario: For the projection, parties that are already represented in the European Parliament are assigned to their current parliamentary group, unless they have explicitly declared that they will change group after the next European election. National parties that are not currently represented in the European Parliament, but belong to a European political party, are attributed to the parliamentary group of that party. In cases where the members of a national electoral list are expected to split up and join different political groups after the election, the projection uses the allocation that seems most plausible in each case (see below). Parties for which the allocation to a specific parliamentary group is unclear are classified as “others” in the baseline scenario.
According to the Rules of Procedure of the European Parliament, at least 23 MEPs from at least a quarter of the member states are required to form a parliamentary group. Groupings marked with an asterisk (*) would not currently meet these conditions according to the projection. They would therefore have to win over additional MEPs after the European elections in order to be able to constitute themselves as a parliamentary group.
Dynamic scenario: In the dynamic scenario, all “other” parties are assigned to an already existing parliamentary group (or to the group of non-attached members). In addition, the dynamic scenario also takes into account other group changes that appear politically plausible, even if the respective parties have not yet been publicly announced them. To highlight these changes from the baseline scenario, parties that are assigned to a different parliamentary group in the dynamic scenario are marked in the table with the colour of that group; moreover, the name of the group appears in the mouseover text. The attributions in the dynamic scenario are based on a subjective assessment of the political orientation and strategy of the parties and can therefore be quite uncertain in detail. From an overall perspective, however, the dynamic scenario may be closer to the real distribution of seats after the next European election than the baseline scenario.

Data source

If available, the most recent poll of voting intentions for the European Parliament is used to calculate the seat distribution for each country. In case that more than one poll has been published, the average of all polls from the two weeks preceding the most recent poll is calculated, taking into account only the most recent poll from each polling institute. The cut-off date for taking a survey into account is the last day of its fieldwork, if known, otherwise the day of its publication.
For countries where there are no specific European election polls or where the last such poll was taken more than a fortnight ago, the most recent poll available for the national parliamentary election or the average of all polls for the national or European Parliament from the two weeks preceding the most recent poll available is used instead. For countries where there are no recent polls for parliamentary elections, polls for presidential elections are used instead, where appropriate, with the polling figures for the presidential candidates assigned to the parties of the candidates (this may concern France in particular). For member states for which no recent polls can be found at all, the results of the last national or European elections are used.
As a rule, the national poll results of the parties are directly converted to the total number of seats in the country. For countries where the election is held in regional constituencies without proportional representation (currently Belgium and Ireland), regional polling data is used where available. Where this is not the case, the number of seats is still calculated for each constituency individually, but using the overall national polling data in each case. National electoral thresholds are taken into account in the projection where they exist.
In Belgium, constituencies in the European election correspond to language communities, while polls are usually conducted at the regional level. The projection uses polling data from Wallonia for the French-speaking community and polling data from Flanders for the Dutch-speaking community. For the German-speaking community, it uses the result of the last European election (1 seat for CSP).
In countries where it is common for several parties to run as an electoral alliance on a common list, the projection makes a plausibility assumption about the composition of these lists. In the table, such multi-party lists are usually grouped under the name of the electoral alliance or of its best-known member party. Sometimes, however, the parties of an electoral alliance split up after the election and join different political groups in the European Parliament. In this case, the parties are listed individually and a plausibility assumption is made about the exact distribution of seats on the joint list. This concerns the following parties: Italy: SI (place 1 and 3 on the list) and EV (2, 4); Spain: Más País (1-2), Compromís (3) and Equo (4); ERC (1, 3-4), Bildu (2) and BNG (5); PNV (1) and CC (2); Netherlands: CU (1, 3-4) and SGP (2, 5); Hungary: Fidesz (1-6, from 8) and KDNP (7); Bulgaria: DSB (1-2) and ZD (3); Slovakia: PS (1) and Spolu (2).
Since there is no electoral threshold for European elections in Germany, parties can win a seat in the European Parliament with less than 1 per cent of the vote. Since German polling institutes do not usually report values for very small parties, the projection includes them based on their results at the last European election (2 seats each for PARTEI and FW, 1 seat each for Tierschutzpartei, ödp, Piraten, Volt and Familienpartei). Only if a small party achieves a better value in current polls than in the last European election, the poll rating is used instead.
In Italy, a special rule makes it easier for minority parties to enter the European Parliament. In the projection, the Südtiroler Volkspartei is therefore always listed with its result at the last European election (1 seat).
 
The following overview lists the data source for each member state. The dates refer to the last day of the fieldwork; if this is not known, to the day of publication of the polls:
Germany: national polls, 24/11-3/12/2022, source: Wikipedia.
France: national polls, 4/11/2022, source: Europe Elects.
Italy: national polls, 21/11-5/12/2022, source: Wikipedia.
Spain: national polls, 20/11-2/12/2022, source: Wikipedia.
Poleand: national polls, 21/11-4/12/2022, source: Wikipedia.
Romania: national polls, 22/11/2022, source: Wikipedia.
Netherlands: national polls, 14-28/11/2022, source: Wikipedia.
Greece: national polls, 12-22/11/2022, source: Wikipedia.
Belgium, French-speaking community: regional polls (Wallonia) for the national parliamentary election, 29/11/2022, source: Wikipedia.
Belgium, Dutch-speaking community: regional polls (Flanders) for the national parliamentary election, 29/11/2022, source: Wikipedia.
Belgium, German-speaking community: European election results, 26/5/2019.
Portugal: national polls, 17-20/11/2022, source: Wikipedia.
Czech Republic: national polls, 31/10-4/11/2022, source: Wikipedia.
Hungary: national polls, 22-28/11/2022, source: Wikipedia.
Sweden: national polls, 17/11-1/12/2022 source: Wikipedia.
Austria: national polls, 1/12/2022, source: Wikipedia.
Bulgaria: national parliamentary election results, 2/10/2022, source: Wikipedia.
Denmark: national polls, 27/11/2022, source: Wikipedia.
Finland: national polls, 1-11/11/2022, source: Wikipedia.
Slovakia: national polls, 28/11/2022, source: Wikipedia.
Irleand: national polls, 23/11-2/12/2022, source: Wikipedia.
Croatia: national polls, 25/11-4/12/2022, source: Wikipedia.
Lithuania: national polls, 8-19/11/2022, source: Wikipedia.
Latvia: national polls, 19/10/2022, source: Wikipedia.
Slovenia: national polls, 11-24/11/2022, source: Wikipedia.
Estonia national polls, 17-28/11/2022, source: Wikipedia.
Cyprus: national parliamentary election results, 30/5/2021, source: Wikipedia.
Luxembourg: national polls, 7/6/2021, source: Europe Elects.
Malta: national polls, 1/12/2022, source: Malta Today.
 
Translation: Yannik Uhlenkotte / Manuel Müller.
Images: All graphs: Manuel Müller.

07 Dezember 2022

Wenn an diesem Sonntag Europawahl wäre (Dezember 2022): S&D legt deutlich zu, Liberale verlieren


Linke G/EFA S&D RE EVP EKR ID fʼlos Sonst.
EP heute3871146102176636445
Okt. 22524212710016979633538
Dez. 2251441369316679643735
dynamisch535013910017083
8030
Basis-Szenario,
Stand: 6.12.2022.


Dynamisches Szenario,
Stand: 6.12.2022.

Wer die Europawahl-Sitzprojektionen auf diesem Blog regelmäßig verfolgt, der kennt das Phänomen: Plötzliche Sprünge gibt es in der Projektion vor allem dann, wenn in einzelnen Mitgliedstaaten dramatische politische Entwicklungen stattfinden – oder wenn es in Frankreich eine neue Umfrage gibt. In keinem anderen EU-Land ist die Politik so stark auf die Person der Präsident:in zugeschnitten; Umfragen, die parteipolitische Präferenzen abfragen, gibt es abseits des unmittelbaren Parlamentswahlkampfes kaum. Wenn dann, wie jetzt Anfang November, doch einmal eine erscheint, so hat sich die politische Stimmung in der Zwischenzeit oft deutlich verändert. Und weil Frankreich einer der größten Mitgliedstaaten ist, macht sich das dann unmittelbar auch auf europäischer Ebene bemerkbar.

Im aktuellen Fall ist es die sozialdemokratische Fraktion S&D, die durch die neue französische Umfrage gegenüber der letzten Europawahlprojektion von Oktober jäh dazugewinnt. Bei der nationalen Parlamentswahl im Juni war der französische PS so weit abgerutscht, dass er in der Projektion gar nicht mehr vorkam. Nach den aktuellen Umfragewerten würde die Partei hingegen wieder klar ins Europäische Parlament einziehen, womit sich die Lage auch für die S&D-Fraktion als Ganzes deutlich verbessert. Einbußen verzeichnen hingegen die Liberalen, die Konservativen und die Linke, und auch hier schlägt sich jeweils die französische Entwicklung in der europäischen Sitzprojektion wider.

S&D gewinnt stark dazu

Allerdings ist Frankreich nicht das einzige Land, in dem es für die Sozialdemokrat:innen in den letzten Wochen etwas besser lief. Auch in Deutschland, Spanien, Ungarn, Schweden, Dänemark und Litauen konnten S&D-Mitgliedsparteien zuletzt leicht zulegen. Verluste gab es hingegen in Italien, wo der PD nach der Niederlage bei der nationalen Parlamentswahl im September noch um seine künftige Ausrichtung ringt.

Auch in den Niederlanden, Portugal, Österreich und Kroatien schnitten sozialdemokratische Parteien in den Umfragen zuletzt etwas schlechter ab. Dennoch gewinnt die S&D unter dem Strich deutlich hinzu und würde nun 136 Sitze erreichen (+9 gegenüber Oktober).

EVP etwas verschlechtert

Die christdemokratisch-konservative Europäische Volkspartei (EVP) konnte zuletzt unter anderem in Deutschland und Kroatien zulegen. Auch das lettische EVP-Mitglied JV, das Anfang Oktober die nationalen Parlamentswahl gewann, baute in der ersten seitdem erschienen Umfrage seinen Vorsprung noch weiter aus.

Hingegen sackt die italienische FI nach ihrer Beteiligung am rechten Regierungsbündnis um Giorgia Meloni (FdI/EKR) weiter ab, und der spanische PP zahlt in den Umfragen offenbar einen Preis für seine Blockade des nationalen Justizrats. Auch die Werte der EVP-Mitgliedsparteien aus Frankreich, Portugal und Dänemark verschlechterten sich in den letzten Wochen. Insgesamt erreicht die Fraktion damit noch 166 Sitze (–3).

Liberale mit deutlichen Einbußen

Noch deutlicher fallen die Verluste der liberalen Fraktion Renew Europe (RE) aus. Deren Mitgliedsparteien verlieren außer in Frankreich auch in Deutschland und Polen. Die schwedischen Liberalerna, deren Unterstützung für das neue rechte Regierungsbündnis einigen Ärger in der RE ausgelöst hat, würden nun gar nicht mehr ins Europäische Parlament einziehen.

Zugewinne macht unter den RE-Mitgliedern nur die dänische LA: Ähnlich wie andere Zentrumsparteien schnitt sie bei der nationalen Parlamentswahl Anfang November sehr gut ab und kann sich mit diesem Ergebnis auch Hoffnungen auf einen Sitz im Europäischen Parlament machen. Für die Fraktion als Ganzes ist das aber natürlich nicht genug: Sie fällt in der Projektion auf 93 Sitze zurück (–7), ihren schlechtesten Wert seit zwei Jahren.

Grüne legen zu

Weiter links im politischen Spektrum zählen zu den Gewinnern der letzten Wochen auch die europäischen Grünen, die jüngst in Kopenhagen ihren nur einmal pro Wahlperiode stattfindenden Parteikongress abgehalten haben. Zwar kommt das traditionelle Zugpferd der G/EFA-Fraktion, die deutschen Grünen, gerade nicht vom Fleck. In Frankreich und den Niederlanden legen die Grünen jedoch leicht zu, und auch die tschechischen Piráti, die ebenfalls der G/EFA angehören, verzeichneten zuletzt etwas bessere Umfragewerte. Insgesamt kommt die Fraktion damit auf 44 Sitze (+2).

Die Linke wiederum muss in Frankreich deutliche Verluste einstecken, kann aber in mehreren anderen Ländern – unter anderem den Niederlanden, Griechenland und Portugal – leicht dazugewinnen. Unter dem Strich hält sich die Linksfraktion damit ein weiteres Mal nahezu unverändert bei 51 Sitzen (–1).

EKR: FdI weiter im Aufwind

Auf der anderen Seite des Parlaments machen in der Rechtsfraktion EKR vor allem die italienischen FdI Furore. Nach ihrem nationalen Wahlsieg im September kann die Partei der neuen Regierungschefin Giorgia Meloni ihren Höhenflug weiter fortsetzen und wäre nun die zweitstärkste nationale Einzelpartei im Europäischen Parlament – vor Emmanuel Macrons französischem Regierungsbündnis Ensemble (RE) und nur hauchdünn hinter der deutschen CDU/CSU (EVP). In Rumänien, Schweden und der Slowakei hatten die EKR-Mitgliedsparteien in den letzten Wochen hingegen etwas schlechtere Umfragewerte, sodass die Fraktion insgesamt unverändert bei 79 Sitzen (±0) liegt.

Wenig Neues gibt es bei der anderen Rechtsfraktion ID. Hier kann sich vor allem die österreichische FPÖ freuen, die nun in einigen Umfragen stärksten nationale Kraft ist. Auch die portugiesische Chega legt weiter zu. Das französische RN hingegen schneidet in der neuen Umfrage etwas schlechter ab als bei der nationalen Parlamentswahl im Juni. Insgesamt verbessert sich die ID-Fraktion damit nur minimal auf 64 Sitze (+1).

Fraktionslose und Sonstige

Ein kleines Comeback erfährt in Frankreich auch die Rechtsaußenpartei Reconquête um Éric Zemmour. Nachdem die erst vor einem Jahr gegründete Partei bei der nationalen Präsidentschaftswahl im April und der Parlamentswahl im Juni krachend gescheitert war, schien sie bereits im Verschwinden begriffen. Nach der neuen Umfrage würde sie jedoch wieder knapp die Fünf-Prozent-Hürde überspringen. Sollte sie dieses Ergebnis bis zur nächsten Europawahl halten, könnte sie die Reihen der fraktionslosen Abgeordneten im Europäischen Parlament weiter füllen.

Derweil schneiden die ungarische Fidesz und die griechische KKE in den jüngsten Umfragen etwas schlechter ab, sodass die Fraktionslosen in der Projektion insgesamt nur leicht dazugewinnen (37 Sitze / +2).

Leichte Verluste erfahren schließlich die „sonstigen“ Parteien, die derzeit nicht im Europäischen Parlament vertreten sind und keiner Fraktion klar zugeordnet werden können. Unter anderem scheint in den Niederlanden die Bauernpartei BBB, die im Zuge der Bauernproteste in diesem Sommer schnell gewachsen war, ihren Zenit inzwischen überschritten zu haben. Gemeinsam kommen die „Sonstigen“ noch auf 35 Sitze (–3).

Die Übersicht

Die folgende Tabelle schlüsselt die Sitzverteilung der Projektion nach nationalen Einzelparteien auf. Die Tabelle folgt dem Basisszenario, in dem nationale Parteien jeweils ihrer aktuellen Fraktion (bzw. der Fraktion ihrer europäischen Dachpartei) zugeordnet sind.

Demgegenüber ordnet das dynamische Szenario der Sitzprojektion alle „sonstigen Parteien“ jeweils den Fraktionen zu, denen diese plausiblerweise am nächsten stehen, und bezieht zudem auch mögliche künftige Fraktionswechsel einzelner nationaler Parteien ein. In der Tabelle sind die Veränderungen im dynamischen Szenario gegenüber dem Basisszenario durch farbige Schrift und durch Hinweise im Mouseover-Text gekennzeichnet.

Da es keine gesamteuropäischen Wahlumfragen gibt, basiert die Projektion auf aggregierten nationalen Umfragen und Wahlergebnissen aus allen Mitgliedstaaten. Wie die Datengrundlage für die Länder im Einzelnen aussieht, ist im Kleingedruckten unter den Tabellen erläutert. Mehr Informationen zu den europäischen Parteien und zu den Fraktionen im Europäischen Parlament gibt es hier.


Linke G/EFA S&D RE EVP EKR ID fʼlos Sonst.
EP heute3871146102176636445
Okt. 22524212710016979633538
Dez. 2251441369316679643735
dynamisch535013910017083
8030

Linke G/EFA S&D RE EVP EKR ID fʼlos Sonst.
DE 5 Linke 18 Grüne
1 Piraten
1 ÖDP
1 Volt
18 SPD 6 FDP
2 FW
27 Union
1 Familie

13 AfD 2 Partei 1 Tier
FR 10 LFI 6 EELV 7 PS 23 Ens 10 LR
19 RN 4 Rec
IT

14 PD 6 Az-IV 7 FI
1 SVP
26 FdI 7 Lega 15 M5S
ES 7 UP
1 Bildu
1 ERC 17 PSOE 1 Cʼs
1 PNV
19 PP 10 Vox
1 JxC 1 MP
PL

5 Lewica 5 PL2050
16 KO
3 KP
20 PiS

3 Konf
RO

14 PSD 3 USR 9 PNL
2 UDMR
5 AUR


NL 2 PvdD
2 SP
3 GL
2 PvdA 5 VVD
3 D66
1 CDA
1 CU
2 JA21
1 SGP
4 PVV
3 BBB
EL 7 Syriza
3 PASOK
8 ND 1 EL
1 KKE 1 MeRA25
BE 3 PTB 1 Groen
1 Ecolo
2 Vooruit
2 PS
1 O-VLD
2 MR
1 CD&V
1 LE
1 CSP
3 N-VA 3 VB

PT 1 BE
1 CDU

8 PS 1 IL 7 PSD
3 CH

CZ
3 Piráti

8 ANO 1 STAN
1 TOP09
5 ODS 3 SPD
HU

4 DK
1 MSZP
1 MM 1 KDNP

12 Fidesz
2 MHM
SE 2 V 1 MP 8 S 1 C
4 M
1 KD
4 SD


AT
2 Grüne 5 SPÖ 2 Neos 4 ÖVP
6 FPÖ

BG

2 BSP 2 DPS 5 GERB
1 DSB


4 PP
2 V
1 BV
DK 1 Enhl. 1 SF 6 S 2 V
1 LA
1 K


1 DD
1 M
FI 1 Vas 1 Vihreät 3 SDP 2 Kesk 4 Kok
3 PS

SK

3 Smer-SSD 1 PS 2 OĽANO
1 Spolu
1 KDH
1 SaS 1 SR 1 REP 3 Hlas-SD
IE 6 SF

3 FF 4 FG


HR

2 SDP
6 HDZ


2 Možemo
1 Most
1 DP
LT
1 LVŽS 3 LSDP 1 LRLS
2 TS-LKD

1 DP 2 DSVL
1 LT
LV


3 JV
1 NA

1 ZZS
1 Prog
1 LRA
1 S!
SI

1 SD 4 GS 2 SDS
1 N.Si


EE


3 RE
1 KE


2 EKRE
1 E200
CY 2 AKEL
1 EDEK
3 DISY


LU
1 Gréng
1 PPLU
1 LSAP 1 DP 2 CSV


MT

4 PL
2 PN


Verlauf (Basisszenario)


Linke G/EFA S&D RE EVP EKR ID fʼlos Sonst.
06.12.2022 51 44 136 93 166 79 64 37 35
12.10.2022 52 42 127 100 169 79 63 35 38
20.08.2022 52 47 134 98 170 75 63 27 39
22.06.2022 54 44 133 101 165 77 64 31 36
25.04.2022 59 39 139 97 157 78 64 38 34
01.03.2022 53 36 139 98 158 78 62 45 36
04.01.2022 51 39 142 99 165 73 62 34 40
08.11.2021 50 42 144 96 155 75 72 36 35
13.09.2021 54 42 141 98 160 70 75 33 32
21.07.2021 52 45 133 97 167 71 74 31 35
24.05.2021 50 50 125 95 167 74 73 33 38
29.03.2021 52 46 136 96 164 71 73 34 33
02.02.2021 52 45 135 94 184 70 71 21 33
09.12.2020 52 47 136 93 188 67 73 20 29
12.10.2020 51 49 127 96 193 67 71 21 30
14.08.2020 50 53 145 88 196 65 64 20 24
25.06.2020 48 55 143 91 203 64 63 20 18
26.04.2020 47 53 151 88 202 66 66 19 13
10.03.2020 51 58 138 88 188 67 82 21 12
09.01.2020 49 58 135 93 186 65 82 24 13
23.11.2019 48 57 138 99 181 62 82 22 16
23.09.2019 49 61 139 108 175 56 82 24 11
30.07.2019 47 64 138 108 180 57 82 22 7
Wahl 2019 40 68 148 97 187 62 76 27

Die Zeile „Wahl 2019“ kennzeichnet die Sitzverteilung zum 2. Juli 2019, dem Zeitpunkt der Konstituierung des Europäischen Parlaments nach der Europawahl im Mai 2019.
Angegeben sind jeweils die Werte im Basisszenario ohne das Vereinigte Königreich. Eine Übersicht der Werte mit dem Vereinigten Königreich für die Zeit bis Januar 2020 ist hier zu finden. Eine Übersicht älterer Projektionen aus der Wahlperiode 2014-2019 gibt es hier.

Die vollen Namen der Fraktionen und der nationalen Einzelparteien erscheinen als Mouseover-Text, wenn der Mauszeiger eine kurze Zeit regungslos auf der Bezeichnung in der Tabelle gehalten wird. Sofern eine Partei im dynamischen Szenario einer anderen Fraktion zugeordnet ist als im Basisszenario, ist dies ebenfalls im Mouseover-Text gekennzeichnet.

Fraktionszuordnung

Basisszenario: Für die Projektion werden Parteien, die bereits im Europäischen Parlament vertreten sind, jeweils ihrer derzeitigen Fraktion zugerechnet, es sei denn, sie haben ausdrücklich ihren Entschluss zu einem Fraktionswechsel nach der nächsten Europawahl erklärt. Nationale Parteien, die derzeit nicht im Europäischen Parlament vertreten sind, aber einer europäischen Partei angehören, werden der Fraktion der entsprechenden europäischen Partei zugeordnet. In Fällen, bei denen sich die Mitglieder einer nationalen Liste nach der Wahl voraussichtlich auf mehrere Fraktionen aufteilen werden, wird jeweils die am plausibelsten scheinende Verteilung zugrundegelegt. Parteien, bei denen die Zuordnung zu einer bestimmten Fraktion unklar ist, werden im Basisszenario als „Sonstige“ eingeordnet.

Für die Bildung einer eigenständigen Fraktion sind nach der Geschäftsordnung des Europäischen Parlaments mindestens 23 Abgeordnete aus mindestens einem Viertel der Mitgliedstaaten erforderlich. Mit einem Asterisk (*) gekennzeichnete Gruppierungen würden diese Bedingungen nach der Projektion derzeit nicht erfüllen. Sie müssten deshalb gegebenenfalls nach der Europawahl zusätzliche Abgeordnete für sich gewinnen, um sich als Fraktion konstituieren zu können.

Dynamisches Szenario: Im dynamischen Szenario werden alle „sonstigen“ Parteien einer schon bestehenden Fraktion (oder der Gruppe der Fraktionslosen) zugeordnet. Außerdem werden gegebenenfalls Fraktionsübertritte von bereits im Parlament vertretenen Parteien berücksichtigt, die politisch plausibel erscheinen, auch wenn sie noch nicht öffentlich angekündigt wurden. Um diese Veränderungen gegenüber dem Basisszenario deutlich zu machen, sind Parteien, die im dynamischen Szenario einer anderen Fraktion zugeordnet werden, in der Tabelle mit der Farbe dieser Fraktion gekennzeichnet; zudem erscheint der Name der möglichen künftigen Fraktion im Mouseover-Text. Die Zuordnungen im dynamischen Szenario basieren auf einer subjektiven Einschätzung der politischen Ausrichtung und Strategie der Parteien und können daher im Einzelnen recht unsicher sein. In der Gesamtschau kann das dynamische Szenario jedoch näher an der wirklichen Sitzverteilung nach der nächsten Europawahl liegen als das Basisszenario.

Datengrundlage

Soweit verfügbar, wird bei der Sitzberechnung für jedes Land jeweils die jüngste Umfrage zu den Wahlabsichten für das Europäische Parlament herangezogen. Wo mehr als eine Umfrage erschienen ist, wird der Durchschnitt aller Umfragen aus den letzten zwei Wochen vor der jüngsten Umfrage berechnet, wobei jedoch von jedem einzelnen Umfrageinstitut nur die jeweils letzte Umfrage berücksichtigt wird. Stichtag für die Berücksichtigung einer Umfrage ist, soweit bekannt, jeweils der letzte Tag der Durchführung, andernfalls der Tag der Veröffentlichung.
Für Länder, in denen es keine spezifischen Europawahlumfragen gibt oder die letzte solche Umfrage mehr als zwei Wochen zurückliegt, wird stattdessen die jüngste verfügbare Umfrage für die Wahl zum nationalen Parlament bzw. der Durchschnitt aller Umfragen für das nationale oder das Europäische Parlament aus den letzten zwei Wochen vor der jüngsten verfügbaren Umfrage verwendet. Für Länder, in denen es keine aktuellen Umfragen für Parlamentswahlen gibt, wird stattdessen gegebenenfalls auf Umfragen zu Präsidentschaftswahlen zurückgegriffen, wobei die Umfragewerte der Präsidentschaftskandidat:innen jeweils den Parteien der Kandidat:innen zugeordnet werden (dies kann insbesondere Frankreich betreffen). Für Mitgliedstaaten, für die sich überhaupt keine Umfragen finden lassen, wird auf die Ergebnisse der letzten nationalen Parlaments- oder Europawahl zurückgegriffen.
In der Regel werden die nationalen Umfragewerte der Parteien direkt auf die Gesamtzahl der Sitze des Landes umgerechnet. Für Länder, in denen die Wahl in regionalen Wahlkreisen ohne Verhältnisausgleich erfolgt (aktuell Belgien und Irland), werden regionale Umfragedaten genutzt, soweit diese verfügbar sind. Wo dies nicht der Fall ist, wird die Sitzzahl für jeden Wahlkreis einzeln berechnet, dabei aber jeweils die nationalen Gesamt-Umfragewerte herangezogen. Nationale Sperrklauseln werden, soweit vorhanden, in der Projektion berücksichtigt.
In Belgien entsprechen die Wahlkreise bei der Europawahl den Sprachgemeinschaft, während Umfragen üblicherweise auf Ebene der Regionen durchgeführt werden. Für die Projektion werden für die französischsprachige Gemeinschaft die Umfragedaten aus Wallonien, für die niederländischsprachige Gemeinschaft die Umfragedaten aus Flandern genutzt. Für die deutschsprachige Gemeinschaft wird das Ergebnis der letzten Europawahl herangezogen (1 Sitz für CSP).
In Ländern, in denen es üblich ist, dass mehrere Parteien als Wahlbündnis auf einer gemeinsamen Liste antreten, werden der Projektion plausibel erscheinende Listengemeinschaften zugrunde gelegt. In der Tabelle sind diese in der Regel unter der Bezeichnung des Wahlbündnisses oder der größten dazugehörigen Partei zusammengefasst. Manchmal gehören die Parteien eines Wahlbündnisses im Europäischen Parlament jedoch unterschiedlichen Fraktionen an. In diesem Fall werden die Parteien einzeln aufgeführt und eine Plausibilitätsannahme über die Verteilung der Sitze auf der gemeinsamen Liste getroffen. Dies betrifft folgende Parteien: Italien: SI (1., 3. Listenplatz) und EV (2., 4.); Spanien: Más País (1.-2.), Compromís (3.) und Equo (4.); ERC (1., 3.-4.), Bildu (2.) und BNG (5.); PNV (1.) und CC (2.); Niederlande: CU (1., 3.-4.) und SGP (2., 5.); Ungarn: Fidesz (1.-6., ab 8.) und KDNP (7.); Bulgarien: DSB (1.-2.) und ZD (3.); Slowakei: PS (1.) und Spolu (2.).
Da es in Deutschland bei der Europawahl keine Sperrklausel gibt, können Parteien bereits mit weniger als 1 Prozent der Stimmen einen Sitz im Europäischen Parlament gewinnen. Da deutsche Umfrageinstitute für Kleinparteien jedoch in der Regel keine Werte ausweisen, wird in der Projektion jeweils das Ergebnis der letzten Europawahl herangezogen (je 2 Sitze für PARTEI und FW, je 1 Sitz für Tierschutzpartei, ödp, Piraten, Volt und Familienpartei). Nur falls eine Kleinpartei in aktuellen Umfragen einen besseren Wert erreicht als bei der letzten Europawahl, wird stattdessen dieser Umfragewert genutzt.
In Italien können Minderheitenparteien durch eine Sonderregelung auch mit nur recht wenigen Stimmen ins Parlament einziehen. In der Projektion wird die Südtiroler Volkspartei deshalb stets mit dem Ergebnis der letzten Europawahl (1 Sitz) geführt.

Die folgende Übersicht führt die Datengrundlage für die Mitgliedstaaten im Einzelnen auf. Die Daten beziehen sich auf den letzten Tag der Durchführung; falls dieser nicht bekannt ist, auf den Tag der Veröffentlichung der Umfragen:
Deutschland: nationale Umfragen, 24.11.-3.12.2022, Quelle: Wikipedia.
Frankreich: nationale Umfragen, 4.11.2022, Quelle: Europe Elects.
Italien: nationale Umfragen, 21.11.-5.12.2022, Quelle: Wikipedia.
Spanien: nationale Umfragen, 20.11.-2.12.2022, Quelle: Wikipedia.
Polen: nationale Umfragen, 21.11.-4.12.2022, Quelle: Wikipedia.
Rumänien: nationale Umfragen, 22.11.2022, Quelle: Wikipedia.
Niederlande: nationale Umfragen, 14.-28.11.2022, Quelle: Wikipedia.
Griechenland: nationale Umfragen, 12.-22.11.2022, Quelle: Wikipedia.
Belgien, französischsprachige Gemeinschaft: regionale Umfragen (Wallonien) für die nationale Parlamentswahl, 29.11.2022, Quelle: Wikipedia.
Belgien, niederländischsprachige Gemeinschaft: regionale Umfragen (Flandern) für die nationale Parlamentswahl, 29.11.2022, Quelle: Wikipedia.
Belgien, deutschsprachige Gemeinschaft: Ergebnis der Europawahl, 26.5.2019.
Portugal: nationale Umfragen, 17.-20.11.2022, Quelle: Wikipedia.
Tschechien: nationale Umfragen, 31.10.-4.11.2022, Quelle: Wikipedia.
Ungarn: nationale Umfragen, 22.-28.11.2022, Quelle: Wikipedia.
Schweden: nationale Umfragen, 17.11.-1.12.2022 Quelle: Wikipedia.
Österreich: nationale Umfragen, 1.12.2022, Quelle: Wikipedia.
Bulgarien: Ergebnisse der nationalen Parlamentswahl, 2.10.2022, Quelle: Wikipedia.
Dänemark: nationale Umfragen, 27.11.2022, Quelle: Wikipedia.
Finnland: nationale Umfragen, 1.-11.11.2022, Quelle: Wikipedia.
Slowakei: nationale Umfragen, 28.11.2022, Quelle: Wikipedia.
Irland: nationale Umfragen, 23.11.-2.12.2022, Quelle: Wikipedia.
Kroatien: nationale Umfragen, 25.11.-4.12.2022, Quelle: Wikipedia.
Litauen: nationale Umfragen, 8.-19.11.2022, Quelle: Wikipedia.
Lettland: nationale Umfragen, 19.10.2022, Quelle: Wikipedia.
Slowenien: nationale Umfragen, 11.-24.11.2022, Quelle: Wikipedia.
Estland: nationale Umfragen, 17.-28.11.2022, Quelle: Wikipedia.
Zypern: Ergebnisse der nationalen Parlamentswahl, 30.5.2021, Quelle: Wikipedia.
Luxemburg: nationale Umfragen, 7.6.2021, Quelle: Europe Elects.
Malta: nationale Umfragen, 1.12.2022, Quelle: Malta Today.

Bilder: alle Grafiken: Manuel Müller.