| Linke | G/EFA | S&D | RE | EVP | EKR | ID | fʼlos | Sonst. | |
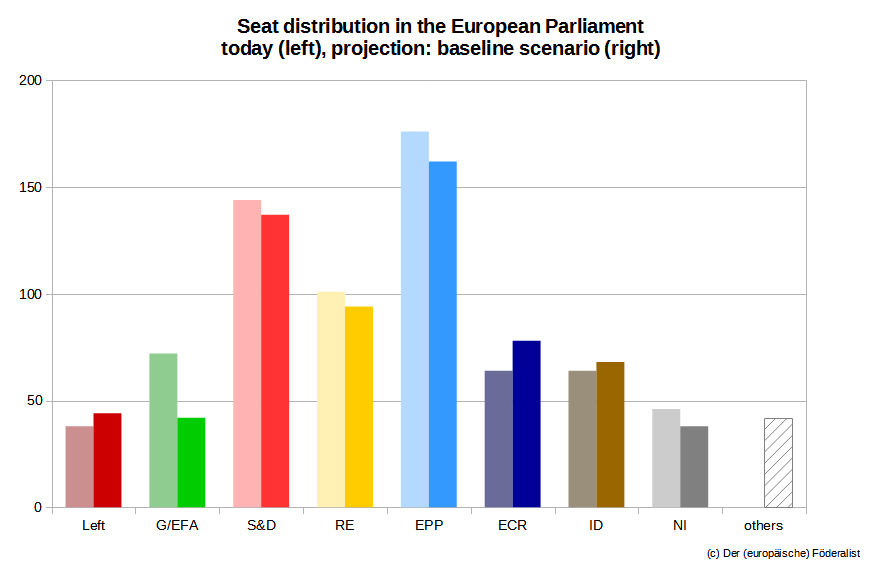
| EP heute | 38 | 72 | 144 | 101 | 176 | 64 | 64 | 46 | – |
| Feb. 23 | 50 | 42 | 135 | 96 | 168 | 78 | 65 | 37 | 34 |
| März 22 | 44 | 42 | 137 | 94 | 162 | 78 | 68 | 38 | 42 |
| dynamisch | 46 | 46 | 141 | 102 | 170 | 81 | 84 | 35 | – |


- Basis-Szenario,
Stand: 27.3.2023.


- Dynamisches Szenario,
Stand: 27.3.2023.
Vierzehn Monate vor der Europawahl 2024 wird der zweitgrößte EU-Mitgliedstaat Frankreich von Streiks und Demonstrationen gegen die zentristisch-liberale Regierung in Atem gehalten. Die Proteste hatten einen nationalen Auslöser – die umstrittene Rentenreform – und es gibt keine Anzeichen, dass sie auf andere Länder übergreifen könnten. Dennoch schlagen sie sich in der Sitzprojektion für das Europäische Parlament nieder.
Wenn jetzt Europawahl wäre, würde die liberale Fraktion RE, der das französische Regierungsbündnis Ensemble angehört, schwächer abschneiden als in der letzten Projektion von Anfang Februar. Umgekehrt legt die Rechtsaußen-Fraktion ID vor allem dank der Zuläufe ihres französischen Mitglieds, Marine Le Pens Rassemblement National (RN), kräftig zu. Nach der deutschen CDU/CSU (EVP) und der italienischen Regierungspartei FdI (EKR) wäre RN nun wieder die drittstärkste nationale Einzelpartei im Europäischen Parlament.
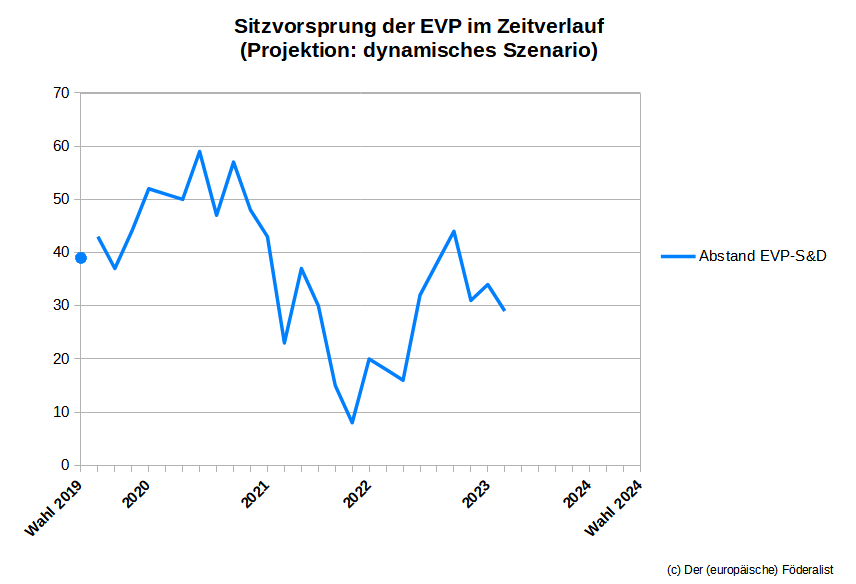
Gleichzeitig wird auch das Rennen um den ersten Platz wieder etwas spannender: Der Vorsprung der Europäischen Volkspartei (EVP) auf ihre sozialdemokratischen Verfolger:innen (S&D) schrumpft ein wenig und beträgt im Basis-Szenario nun nur noch 25 Sitze (–8 im Vergleich zur Februar-Projektion). Von einem Kopf-an-Kopf-Rennen zu sprechen, wäre verfrüht, aber der Abstand ist jedenfalls knapper als bei der letzten Europawahl.
EVP: Tiefster Wert seit einem Jahr
Betrachtet man die Fraktionen im Einzelnen, so zeigen sich sowohl für die EVP als auch für die S&D je nach Mitgliedstaat unterschiedliche Entwicklungen. Die EVP verliert in Frankreich und Litauen leicht, zudem würden mehrere kleinere Mitgliedsparteien aus mittel- und osteuropäischen Ländern (UDMR aus Rumänien, KDU-ČSL aus Tschechien, OĽANO aus der Slowakei und N.Si aus Slowenien) derzeit knapp nicht ins Parlament einziehen. Leicht zulegen können die Konservativen hingegen in Schweden und auf Malta.
Insgesamt erreicht die EVP damit im Basisszenario noch 162 Sitze (–6); das ist ihr schlechtester Wert seit rund einem Jahr. Die schwächelnden Umfragewerte werfen die Frage auf, wie intensiv sich die EVP um den Beitritt neuer Parteien bemühen sollte, um den Platz als stärkste Fraktion auch nach der Europawahl zu verteidigen. Dass sich EVP-Chef Manfred Weber (CSU/EVP) Anfang des Jahres erkennbar um eine Annäherung an die italienische Regierungspartei FdI (EKR) bemühte, löste deshalb einige Aufregung aus. Anfang Februar dementierte allerdings Markus Söder, bayrischer Ministerpräsident und Chef von Webers nationaler Partei CSU, die Beitrittsgerüchte ausdrücklich.
Weniger öffentliche Aufmerksamkeit fand demgegenüber die erst 2019 gegründete agrarisch-konservative BBB aus den Niederlanden. Nach deren Erdrutschsieg bei den nationalen Provinzwahlen könnte auch sie jedoch ein interessantes Anwerbeziel für die EVP werden. Der Haken: Die BBB verdankt ihren jüngsten Erfolg vor allem ihrer Rolle als populistische Protestpartei – auch gegen von der EU vorgegebene Grenzwerte für Stickstoff-Emissionen. Zwei Jahre nach dem Austritt der ungarischen Fidesz geht es für die EVP also wieder einmal darum, wie weit sie sich für (rechts)populistische Parteien unterschiedlicher Spielarten öffnen oder diese den Rechtsfraktionen ID und EKR überlassen will.
S&D legt in Südeuropa zu
Die sozialdemokratische S&D-Fraktion wiederum profitierte in den letzten Wochen vor allem von Entwicklungen in Südeuropa: Beim italienischen PD sorgte der Sieg der charismatischen Linksaktivistin Elly Schlein bei der Wahl zum Parteivorsitz für einen Umfragen-Höhenflug; in Spanien verschaffte ein gescheitertes Misstrauensvotum gegen Premierminister Pedro Sánchez dem regierenden PSOE Auftrieb. Auch in den Niederlanden und Estland legten die Sozialdemokrat:innen leicht zu. Zudem wird die slowakische Hlas-SD in der Projektion nun nicht mehr nur im dynamischen, sondern auch im Basisszenario der S&D-Fraktion zugerechnet.
In anderen Ländern – etwa Rumänien, Griechenland, Bulgarien und Malta – schnitten die S&D-Mitgliedsparteien in den letzten Wochen hingegen schlechter ab als Anfang Februar. Unter dem Strich steht für die S&D-Fraktion im Basisszenario deshalb nur ein leichter Zugewinn (137 Sitze/+2).
Rückschläge für RE
Die zentristisch-liberale RE-Fraktion erfuhr zuletzt gleich in mehreren großen Mitgliedstaaten Rückschläge: Sowohl die französischen Proteste um die Rentenreform als auch die niederländischen Bauernproteste wenden sich gegen liberale Regierungen und ziehen die dortigen RE-Parteien in den Umfragen nach unten. Auch in Italien verlor das liberale Bündnis Azione/Italia Viva um Ex-Regierungschef Matteo Renzi wenigstens kurzfristig an den wiedererstarkten PD (anders als Renzi selbst erwartet hatte, der einen Linksruck des PD unter Elly Schlein als das „bestmögliche Ergebnis“ bezeichnete, um sich selbst in der politischen Mitte zu profilieren).
Leicht zulegen können die Liberalen hingegen in Rumänien und Bulgarien. Zudem werden die dänischen Moderaterne jetzt auch in der Basisprojektion der RE-Fraktion zugerechnet, nachdem sie jüngst ihren ersten Europaabgeordneten gewinnen konnten (durch einen Übertritt von Venstre, einer weiteren dänischen RE-Mitgliedspartei). Dennoch steht die RE damit derzeit nur noch bei 94 Sitzen (–2), einem ihrer schlechtesten Werte in dieser Wahlperiode.
Grüne stagnieren, Linke verliert
Leichte Verluste gibt es auch auf der linken Seite des politischen Spektrums. Die Grünen/EFA stagnieren in der Basisprojektion bei 42 Sitzen (±0). Dies liegt unter anderem an Deutschland, wo die Grünen sich schon seit vergangenem Herbst in einem langsamen Abwärtstrend befinden, und an Schweden, wo sie nun wieder knapp unter die nationale Vier-Prozent-Hürde rutschen. Zulegen konnte in den Umfragen zuletzt nur die litauische LVŽS.
Weitere Zugewinne für die Grünen/EFA in der Projektion entstehen durch kleine Berichtigungen, die in der Berechnungsmethode vorgenommen wurden: Zum einen werden die lettischen Progresīvie (die bereits im vergangenen Sommer der Europäischen Grünen Partei beigetreten sind) nun auch im Basisszenario der Grünen/EFA-Fraktion zugeordnet. Zum anderen berücksichtigt die Projektion jetzt die voraussichtliche Kandidatur einer Kandidat:in der katalanischen Partei Catalunya en Comú auf der Liste der Linkspartei Unidas Podemos.
Noch deutlicher als bei den Grünen sind die Verluste bei der Linksfraktion. Weder in Frankreich noch in den Niederlanden können deren Mitgliedsparteien von den Protesten gegen die Regierung profitieren, sondern verlieren gegenüber der Februar-Projektion sogar noch leicht an Sitzen. Auch in Belgien und Portugal schnitten Linksparteien zuletzt schwächer ab als zuvor. Insgesamt erreicht die Linksfraktion damit nur noch 44 Sitze (–6), ihr schlechtester Wert in der ganzen Wahlperiode.
Rechtsfraktionen legen zu
Auf der rechten Seite des Parlaments tritt die rechtskonservative EKR-Fraktion ebenfalls auf der Stelle. In Rumänien konnte ihre Mitgliedspartei AUR konnte zuletzt stark zulegen, was allerdings angesichts der volatilen und oft unzuverlässigen rumänischen Umfragen nicht allzu viel bedeuten muss. Leichte Gewinne verzeichnet auch die tschechische ODS. In den Niederlanden hingegen verlieren alle Rechtsparteien an den populistischen Newcomer BBB; die religiös-konservative SGP würde nun gar keinen Sitz mehr im Europäischen Parlament erzielen. Insgesamt verharrt die EKR-Fraktion damit bei 78 Sitzen (±0).
In der Rechtsaußenfraktion ID legt vor allem das französische RN stark zu, aber auch die deutsche AfD und vor allem die portugiesische Chega können ihren Aufwärtstrend aus den letzten Monaten fortsetzen. Hingegen fiel die estnische EKRE im Wahlkampf vor der nationalen Parlamentswahl Anfang März in den Umfragen deutlich zurück, und auch die tschechische ID-Mitgliedspartei SPD sowie die niederländische PVV verloren zuletzt an Zustimmung. Mit insgesamt 68 Sitzen (+4) verzeichnet die ID-Fraktion dennoch ihren besten Wert seit Ende 2021.
Im dynamischen Szenario, das mögliche Neuzugänge der Fraktionen nach der Europawahl mit berücksichtigt, liegt die ID mit 84 Sitzen sogar erstmals seit langem wieder vor der EKR-Fraktion (81). Allerdings setzt das voraus, dass die ungarische Regierungspartei Fidesz um Viktor Orbán sich nach der Wahl der ID anschließt – was plausibel, aber keineswegs sicher ist.
Deutliche Zuwächse für „sonstige“ Parteien
Bei den fraktionslosen Parteien verzeichnet das linkspopulistische M5S aus Italien leichte Verluste, während die slowakische Rechtsaußenpartei Republika dazugewinnt. Insgesamt kommen die Fraktionslosen damit auf 38 Sitze (+1).
Deutliche Zuwächse gibt es schließlich bei den „sonstigen“ Parteien, die derzeit nicht im Europäischen Parlament vertreten sind und auch keiner europäischen Partei angehören. Neben der niederländischen BBB kann hier vor allem das Mitte-links-Bündnis PRG/FGR aus Frankreich zulegen, das nun erstmals die nationale Fünf-Prozent-Hürde überspringen könnte.
Neu im Tableau sind außerdem die ungarische Satirepartei MKKP sowie die griechische Rechtsaußen-Partei EK. Letztere wurde 2020 vom ehemaligen Parteisprecher der neofaschistischen Chrysi Avgi (XA) gegründet, der – ebenso wie die übrige XA-Führung – derzeit eine Haftstrafe wegen Bildung einer kriminellen Vereinigung absitzt. Ob EK tatsächlich bei der nächsten Europawahl in Griechenland auf dem Wahlzettel stehen wird, ist allerdings ungewiss: Ihre Teilnahme an der bevorstehenden nationalen Parlamentswahl wurde jüngst von der griechischen Regierung verboten.
Insgesamt kommen die „sonstigen“ Parteien damit nun auf 42 Sitze (+8) – immerhin fast sechs Prozent der Gesamtsitzzahl des Parlaments. Weltanschaulich repräsentieren die Newcomer ein buntes Spektrum linker, liberaler, konservativer und rechter Parteien. Die Zusammensetzung des Parlaments nach der nächsten Europawahl wird stark davon abhängen, welchen Fraktionen es gelingt, sie für sich zu gewinnen.
Die Übersicht
Die folgende Tabelle schlüsselt die Sitzverteilung der Projektion nach nationalen Einzelparteien auf. Die Tabelle folgt dem Basisszenario, in dem nationale Parteien jeweils ihrer aktuellen Fraktion (bzw. der Fraktion ihrer europäischen Dachpartei) zugeordnet sind.
Demgegenüber ordnet das dynamische Szenario der Sitzprojektion alle „sonstigen Parteien“ jeweils den Fraktionen zu, denen diese plausiblerweise am nächsten stehen, und bezieht zudem auch mögliche künftige Fraktionswechsel einzelner nationaler Parteien ein. In der Tabelle sind die Veränderungen im dynamischen Szenario gegenüber dem Basisszenario durch farbige Schrift und durch Hinweise im Mouseover-Text gekennzeichnet.
Da es keine gesamteuropäischen Wahlumfragen gibt, basiert die Projektion auf aggregierten nationalen Umfragen und Wahlergebnissen aus allen Mitgliedstaaten. Wie die Datengrundlage für die Länder im Einzelnen aussieht, ist im Kleingedruckten unter den Tabellen erläutert. Mehr Informationen zu den europäischen Parteien und zu den Fraktionen im Europäischen Parlament gibt es hier.
| Linke | G/EFA | S&D | RE | EVP | EKR | ID | fʼlos | Sonst. | |
| EP heute | 38 | 72 | 144 | 101 | 176 | 64 | 64 | 46 | – |
| Feb. 23 | 50 | 42 | 135 | 96 | 168 | 78 | 65 | 37 | 34 |
| März 22 | 44 | 42 | 137 | 94 | 162 | 78 | 68 | 38 | 42 |
| dynamisch | 46 | 46 | 141 | 102 | 170 | 81 | 84 | 35 | – |
| Linke | G/EFA | S&D | RE | EVP | EKR | ID | fʼlos | Sonst. | |
| DE | 5 Linke | 16 Grüne 1 Piraten 1 ÖDP 1 Volt |
19 SPD | 6 FDP 2 FW |
27 Union 1 Familie |
14 AfD | 2 Partei | 1 Tier | |
| FR | 8 LFI | 5 EELV | 6 PS | 20 Ens | 9 LR | 23 RN | 4 Rec | 4 PRG-FGR | |
| IT | 16 PD | 5 Az-IV | 7 FI 1 SVP |
25 FdI | 8 Lega | 14 M5S | |||
| ES | 5 UP 1 Bildu |
1 ERC 1 CatComú |
18 PSOE | 1 Cʼs 1 PNV |
20 PP | 9 Vox | 1 JxC | 1 MP | |
| PL | 4 Lewica | 4 PL2050 |
16 KO 3 KP |
20 PiS | 5 Konf | ||||
| RO | 12 PSD | 4 USR | 9 PNL |
8 AUR | |||||
| NL | 2 PvdD 1 SP |
3 GL |
3 PvdA | 6 VVD 2 D66 |
1 CDA 1 CU |
1 JA21 |
2 PVV | 7 BBB | |
| EL | 7 Syriza | 2 PASOK | 8 ND | 1 EL | 1 KKE | 1 MeRA25
1 EK |
|||
| BE | 2 PTB | 1 Groen 1 Ecolo |
2 Vooruit 2 PS |
1 O-VLD 2 MR |
1 CD&V 1 LE 1 CSP |
3 N-VA | 4 VB | ||
| PT | 1 BE |
7 PS | 2 IL | 7 PSD | 4 CH | ||||
| CZ | 2 Piráti |
9 ANO | 2 STAN 1 TOP09 |
5 ODS | 2 SPD | ||||
| HU | 4 DK |
1 MM | 1 KDNP | 12 Fidesz |
2 MHM 1 MKKP |
||||
| SE | 2 V | 8 S | 1 C |
5 M 1 KD |
4 SD | ||||
| AT | 2 Grüne | 5 SPÖ | 2 Neos | 4 ÖVP | 6 FPÖ | ||||
| BG | 1 BSP | 3 DPS | 5 GERB |
5 PP-DB 3 V |
|||||
| DK | 1 Enhl. | 2 SF | 4 S | 2 V 2 LA 1 M |
1 K | 1 DD |
|||
| FI | 1 Vas | 1 Vihreät | 3 SDP | 2 Kesk | 4 Kok | 3 PS | |||
| SK | 3 Hlas-SD 3 Smer-SSD |
1 PS | 1 D 1 KDH |
1 SaS | 1 SR | 3 REP | |||
| IE | 6 SF | 3 FF | 4 FG | ||||||
| HR | 3 SDP | 6 HDZ | 1 Možemo 1 Most 1 DP |
||||||
| LT | 2 LVŽS | 3 LSDP | 1 LRLS |
2 TS-LKD | 1 DP | 2 DSVL |
|||
| LV | 1 Prog |
2 JV |
1 NA | 2 ZZS 1 LRA 1 S! |
|||||
| SI | 1 SD | 4 GS | 3 SDS |
||||||
| EE | 1 SDE | 3 RE 1 KE |
1 EKRE | 1 E200 | |||||
| CY | 2 AKEL | 1 EDEK 1 DIKO |
2 DISY | ||||||
| LU | 1 Gréng |
2 LSAP | 1 DP | 2 CSV | |||||
| MT | 3 PL | 3 PN |
| Linke | G/EFA | S&D | RE | EVP | EKR | ID | fʼlos | Sonst. | |
| 27.03.2023 | 44 | 42 | 137 | 94 | 162 | 78 | 68 | 38 | 42 |
| 01.02.2023 | 50 | 42 | 135 | 96 | 168 | 78 | 65 | 37 | 34 |
| 06.12.2022 | 51 | 44 | 136 | 93 | 166 | 79 | 64 | 37 | 35 |
| 12.10.2022 | 52 | 42 | 127 | 100 | 169 | 79 | 63 | 35 | 38 |
| 20.08.2022 | 52 | 47 | 134 | 98 | 170 | 75 | 63 | 27 | 39 |
| 22.06.2022 | 54 | 44 | 133 | 101 | 165 | 77 | 64 | 31 | 36 |
| 25.04.2022 | 59 | 39 | 139 | 97 | 157 | 78 | 64 | 38 | 34 |
| 01.03.2022 | 53 | 36 | 139 | 98 | 158 | 78 | 62 | 45 | 36 |
| 04.01.2022 | 51 | 39 | 142 | 99 | 165 | 73 | 62 | 34 | 40 |
| 08.11.2021 | 50 | 42 | 144 | 96 | 155 | 75 | 72 | 36 | 35 |
| 13.09.2021 | 54 | 42 | 141 | 98 | 160 | 70 | 75 | 33 | 32 |
| 21.07.2021 | 52 | 45 | 133 | 97 | 167 | 71 | 74 | 31 | 35 |
| 24.05.2021 | 50 | 50 | 125 | 95 | 167 | 74 | 73 | 33 | 38 |
| 29.03.2021 | 52 | 46 | 136 | 96 | 164 | 71 | 73 | 34 | 33 |
| 02.02.2021 | 52 | 45 | 135 | 94 | 184 | 70 | 71 | 21 | 33 |
| 09.12.2020 | 52 | 47 | 136 | 93 | 188 | 67 | 73 | 20 | 29 |
| 12.10.2020 | 51 | 49 | 127 | 96 | 193 | 67 | 71 | 21 | 30 |
| 14.08.2020 | 50 | 53 | 145 | 88 | 196 | 65 | 64 | 20 | 24 |
| 25.06.2020 | 48 | 55 | 143 | 91 | 203 | 64 | 63 | 20 | 18 |
| 26.04.2020 | 47 | 53 | 151 | 88 | 202 | 66 | 66 | 19 | 13 |
| 10.03.2020 | 51 | 58 | 138 | 88 | 188 | 67 | 82 | 21 | 12 |
| 09.01.2020 | 49 | 58 | 135 | 93 | 186 | 65 | 82 | 24 | 13 |
| 23.11.2019 | 48 | 57 | 138 | 99 | 181 | 62 | 82 | 22 | 16 |
| 23.09.2019 | 49 | 61 | 139 | 108 | 175 | 56 | 82 | 24 | 11 |
| 30.07.2019 | 47 | 64 | 138 | 108 | 180 | 57 | 82 | 22 | 7 |
| Wahl 2019 | 40 | 68 | 148 | 97 | 187 | 62 | 76 | 27 | – |
Die Zeile „Wahl 2019“ kennzeichnet die Sitzverteilung zum 2. Juli 2019, dem Zeitpunkt der Konstituierung des Europäischen Parlaments nach der Europawahl im Mai 2019.
Angegeben sind jeweils die Werte im Basisszenario ohne das Vereinigte Königreich. Eine Übersicht der Werte mit dem Vereinigten Königreich für die Zeit bis Januar 2020 ist hier zu finden. Eine Übersicht älterer Projektionen aus der Wahlperiode 2014-2019 gibt es hier.
Die vollen Namen der Fraktionen und der nationalen Einzelparteien erscheinen als Mouseover-Text, wenn der Mauszeiger eine kurze Zeit regungslos auf der Bezeichnung in der Tabelle gehalten wird. Sofern eine Partei im dynamischen Szenario einer anderen Fraktion zugeordnet ist als im Basisszenario, ist dies ebenfalls im Mouseover-Text gekennzeichnet.
Für die Bildung einer eigenständigen Fraktion sind nach der Geschäftsordnung des Europäischen Parlaments mindestens 23 Abgeordnete aus mindestens einem Viertel der Mitgliedstaaten erforderlich. Mit einem Asterisk (*) gekennzeichnete Gruppierungen würden diese Bedingungen nach der Projektion derzeit nicht erfüllen. Sie müssten deshalb gegebenenfalls nach der Europawahl zusätzliche Abgeordnete für sich gewinnen, um sich als Fraktion konstituieren zu können.
Dynamisches Szenario: Im dynamischen Szenario werden alle „sonstigen“ Parteien einer schon bestehenden Fraktion (oder der Gruppe der Fraktionslosen) zugeordnet. Außerdem werden gegebenenfalls Fraktionsübertritte von bereits im Parlament vertretenen Parteien berücksichtigt, die politisch plausibel erscheinen, auch wenn sie noch nicht öffentlich angekündigt wurden. Um diese Veränderungen gegenüber dem Basisszenario deutlich zu machen, sind Parteien, die im dynamischen Szenario einer anderen Fraktion zugeordnet werden, in der Tabelle mit der Farbe dieser Fraktion gekennzeichnet; zudem erscheint der Name der möglichen künftigen Fraktion im Mouseover-Text. Die Zuordnungen im dynamischen Szenario basieren auf einer subjektiven Einschätzung der politischen Ausrichtung und Strategie der Parteien und können daher im Einzelnen recht unsicher sein. In der Gesamtschau kann das dynamische Szenario jedoch näher an der wirklichen Sitzverteilung nach der nächsten Europawahl liegen als das Basisszenario.
Für Länder, in denen es keine spezifischen Europawahlumfragen gibt oder die letzte solche Umfrage mehr als zwei Wochen zurückliegt, wird stattdessen die jüngste verfügbare Umfrage für die Wahl zum nationalen Parlament bzw. der Durchschnitt aller Umfragen für das nationale oder das Europäische Parlament aus den letzten zwei Wochen vor der jüngsten verfügbaren Umfrage verwendet. Für Länder, in denen es keine aktuellen Umfragen für Parlamentswahlen gibt, wird stattdessen gegebenenfalls auf Umfragen zu Präsidentschaftswahlen zurückgegriffen, wobei die Umfragewerte der Präsidentschaftskandidat:innen jeweils den Parteien der Kandidat:innen zugeordnet werden (dies kann insbesondere Frankreich und Zypern betreffen). Für Mitgliedstaaten, für die sich überhaupt keine Umfragen finden lassen, wird auf die Ergebnisse der letzten nationalen Parlaments- oder Europawahl zurückgegriffen.
In der Regel werden die nationalen Umfragewerte der Parteien direkt auf die Gesamtzahl der Sitze des Landes umgerechnet. Für Länder, in denen die Wahl in regionalen Wahlkreisen ohne Verhältnisausgleich erfolgt (aktuell Belgien und Irland), werden regionale Umfragedaten genutzt, soweit diese verfügbar sind. Wo dies nicht der Fall ist, wird die Sitzzahl für jeden Wahlkreis einzeln berechnet, dabei aber jeweils die nationalen Gesamt-Umfragewerte herangezogen. Nationale Sperrklauseln werden, soweit vorhanden, in der Projektion berücksichtigt.
In Belgien entsprechen die Wahlkreise bei der Europawahl den Sprachgemeinschaft, während Umfragen üblicherweise auf Ebene der Regionen durchgeführt werden. Für die Projektion werden für die französischsprachige Gemeinschaft die Umfragedaten aus Wallonien, für die niederländischsprachige Gemeinschaft die Umfragedaten aus Flandern genutzt. Für die deutschsprachige Gemeinschaft wird das Ergebnis der letzten Europawahl herangezogen (1 Sitz für CSP).
In Ländern, in denen es üblich ist, dass mehrere Parteien als Wahlbündnis auf einer gemeinsamen Liste antreten, werden der Projektion plausibel erscheinende Listengemeinschaften zugrunde gelegt. In der Tabelle sind diese in der Regel unter der Bezeichnung des Wahlbündnisses oder der größten dazugehörigen Partei zusammengefasst. Manchmal gehören die Parteien eines Wahlbündnisses im Europäischen Parlament jedoch unterschiedlichen Fraktionen an. In diesem Fall werden die Parteien einzeln aufgeführt und eine Plausibilitätsannahme über die Verteilung der Sitze auf der gemeinsamen Liste getroffen. Dies betrifft folgende Parteien: Italien: SI (1., 3. Listenplatz) und EV (2., 4.); Spanien: UP (1.-2., ab 4.), CatComú (3.); Más País (1.-2.), Compromís (3.) und Equo (4.); ERC (1., 3.-4.), Bildu (2.) und BNG (5.); PNV (1.) und CC (2.); Niederlande: CU (1., 3.-4.) und SGP (2., 5.); Ungarn: Fidesz (1.-6., ab 8.) und KDNP (7.); Slowakei: PS (1.) und D (2.).
In Frankreich hatten sich für die nationale Parlamentswahl 2022 mehrere Mitte-links-Parteien (LFI, PS, EELV, PCF) zu dem Wahlbündnis NUPES zusammengeschlossen, das teilweise auch in späteren Umfragen noch vorkommt. Es ist jedoch unwahrscheinlich, dass dieses Bündnis auch bei der nächsten Europawahl Bestand hat. In der Projektion werden deshalb die Umfragewerte des Bündnisses jeweils auf die einzelnen Parteien aufgeteilt, und zwar entsprechend dem Verhältnis der durchschnittlichen Umfragewerte der Parteien in den letzten Umfragen, die diese einzeln ausweisen.
Da es in Deutschland bei der Europawahl keine Sperrklausel gibt, können Parteien bereits mit weniger als 1 Prozent der Stimmen einen Sitz im Europäischen Parlament gewinnen. Da deutsche Umfrageinstitute für Kleinparteien jedoch in der Regel keine Werte ausweisen, wird in der Projektion jeweils das Ergebnis der letzten Europawahl herangezogen (je 2 Sitze für PARTEI und FW, je 1 Sitz für Tierschutzpartei, ödp, Piraten, Volt und Familienpartei). Nur falls eine Kleinpartei in aktuellen Umfragen einen besseren Wert erreicht als bei der letzten Europawahl, wird stattdessen dieser Umfragewert genutzt.
In Italien können Minderheitenparteien durch eine Sonderregelung auch mit nur recht wenigen Stimmen ins Parlament einziehen. In der Projektion wird die Südtiroler Volkspartei deshalb stets mit dem Ergebnis der letzten Europawahl (1 Sitz) geführt.
Die folgende Übersicht führt die Datengrundlage für die Mitgliedstaaten im Einzelnen auf. Die Daten beziehen sich auf den letzten Tag der Durchführung; falls dieser nicht bekannt ist, auf den Tag der Veröffentlichung der Umfragen:
Deutschland: nationale Umfragen, 10.-23.3.2023, Quelle: Wikipedia.
Frankreich: nationale Umfragen, 21.3.2023, Quelle: Wikipedia; für die Verteilung zwischen den Mitgliedsparteien des Wahlbündnisses NUPES: nationale Umfragen, 4.11.2022, Quelle: Wikipedia.
Italien: nationale Umfragen, 11.-23.3.2023, Quelle: Wikipedia.
Spanien: nationale Umfragen, 11.-24.3.2023, Quelle: Wikipedia.
Polen: nationale Umfragen, 13.-25.3.2023, Quelle: Wikipedia.
Rumänien: nationale Umfragen, 19.2.-3.3.2023, Quelle: Wikipedia.
Niederlande: nationale Umfragen, 26.-27.3.2023, Quelle: Wikipedia.
Griechenland: nationale Umfragen, 7.-20.3.2023, Quelle: Wikipedia.
Belgien, französischsprachige Gemeinschaft: regionale Umfragen (Wallonien) für die nationale Parlamentswahl, 29.1.2023, Quelle: Wikipedia.
Belgien, niederländischsprachige Gemeinschaft: regionale Umfragen (Flandern) für die nationale Parlamentswahl, 29.1.2023, Quelle: Wikipedia.
Belgien, deutschsprachige Gemeinschaft: Ergebnis der Europawahl, 26.5.2019.
Portugal: nationale Umfragen, 15.3.2023, Quelle: Wikipedia.
Tschechien: nationale Umfragen, 3.-7.3.2023, Quelle: Wikipedia.
Ungarn: nationale Umfragen, 8.-16.3.2023, Quelle: Wikipedia.
Schweden: nationale Umfragen, 6.-16.3.2023, Quelle: Wikipedia.
Österreich: nationale Umfragen, 9.-11.3.2023, Quelle: Wikipedia.
Bulgarien: nationale Umfragen, 12.-22.3.2023, Quelle: Wikipedia.
Dänemark: nationale Umfragen, 13.-19.3.2023, Quelle: Wikipedia.
Finnland: nationale Umfragen, 23.3.2023, Quelle: Wikipedia.
Slowakei: nationale Umfragen, 12.-22.3.2023, Quelle: Wikipedia.
Irland: nationale Umfragen, 14.-22.3.2023, Quelle: Wikipedia.
Kroatien: nationale Umfragen, 20.-24.3.2023, Quelle: Wikipedia.
Litauen: nationale Umfragen, 18.-28.2.2023, Quelle: Wikipedia.
Lettland: nationale Umfragen, Januar 2023, Quelle: Wikipedia.
Slowenien: nationale Umfragen, 15.-23.3.2023, Quelle: Wikipedia.
Estland: nationale Umfragen, 17.-20.3.2023, Quelle: Wikipedia.
Zypern: Ergebnisse der ersten Runde der nationalen Präsidentschaftswahl, 5.2.2023, Quelle: Wikipedia.
Luxemburg: nationale Umfragen, 28.11.2022, Quelle: Wikipedia.
Malta: nationale Umfragen, 10.-16.3.2023, Quelle: Wikipedia.