| Left | G/EFA | S&D | RE | EPP | ECR | ID | NI | other | |
| EP today | 38 | 71 | 141 | 101 | 178 | 67 | 58 | 51 | – |
| Nov. 23 | 43 | 43 | 137 | 90 | 170 | 78 | 76 | 38 | 45 |
| Jan. 24 | 33 | 45 | 141 | 86 | 169 | 75 | 89 | 43 | 39 |
| dynamic | 35 | 47 | 143 | 91 | 177 | 85 | 108 | 34 | – |


- Baseline scenario,
as of 08/01/2024.


- Dynamic scenario,
as of 08/01/2024.

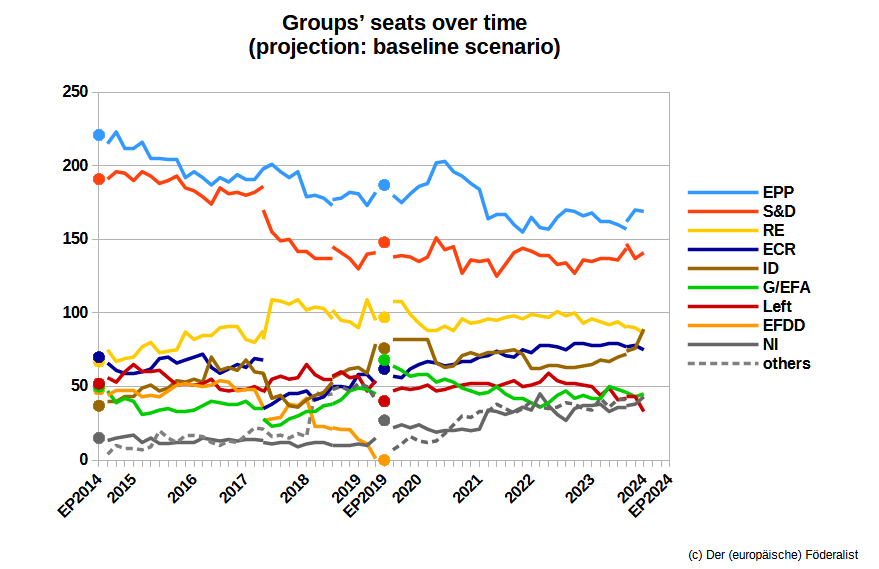
At the start of the European election year, many of the trends that have been emerging in recent months are intensifying: Compared with the seat projection for November 2023, the centre-left camp continues to lose ground – this time because the liberal RE group and, above all, the Left group are in decline –, whereas the far-right camp, or more precisely the ID group, makes further gains, overtaking the Liberals to become the third strongest force in the projection. Meanwhile, there is little change for the two largest groups in the Parliament: The socialist S&D group slightly improves its position, but the centre-right EPP retains a comfortable lead.
Few changes for EPP and S&D
For the European People’s Party, the election year begins with no major changes. The members of the large centre-right group have recently made slight gains in German and French polls, but have lost ground in Poland and a few other countries. Overall, they now have 169 seats in the baseline scenario (–1 compared to November). In the dynamic scenario, which also takes into account the possibility of new member parties joining the group, the EPP reaches 177 seats. It benefits in particular from its popularity in the Netherlands, where two newcomer parties – the centre-right NSC and the agrarian populist BBB – both see their future in the EPP.
The Socialists, on the other hand, continue to lose ground in Germany, but are improving in Poland, Hungary and Portugal, among other countries, and would now reach a total of 141 seats (+4). In the dynamic scenario the figure is only slightly better (143 seats). As a result, both the S&D and the EPP would roughly maintain the number of seats that they already have in the current parliament.
Weakened RE
Meanwhile, the RE group has suffered significant losses in recent weeks. The Liberals were particularly shaken by the aftermath of the Dutch general election in November, in which the liberal VVD party, which had led the Dutch government since 2010, came in third behind the far-right PVV (ID) and the red-green alliance between the PvdA (S&D) and GroenLinks (G/EFA). After the election, the VVD fell even further in the polls. Beyond that, RE also lost ground in other countries such as Portugal and Sweden, while making small gains in Italy, Poland, and Romania.
All in all, this leaves the Liberals with just 86 seats (–4) – their worst projected result since the rise of Emmanuel Macron’s LREM in the summer of 2017. The dynamic scenario is only slightly better: Here, the RE group stands at 91 seats, its worst figure since spring 2020.
Plummeting Left
Meanwhile, the Left group is losing even more, plummeting to 33 seats (–10, dynamic scenario: 35), its worst projected result since regular seat projections began in 2014. This is particularly due to France, where the main left-wing party LFI is increasingly isolated and has lost much support because of its ambivalent stance on antisemitism, while the smaller PCF has slipped below the five-percent threshold in the polls.
But the Left has also weakened recently in the Netherlands, Belgium and Portugal. Moreover, in Spain the left-wing Podemos party has split from the left-green alliance Sumar, meaning that Sumar is now dominated by parties with a Green orientation – while Podemos itself is only a shadow of its former strength in the polls. In Germany, on the other hand, former Linke leader Sahra Wagenknecht has recently founded a new party which will compete with the Left and whose future group membership in the European Parliament remains a matter of speculation. The decline of the Left is taking place amid internal disputes and divisions, which the European Left is struggling to contain.
The Greens/EFA group, on the other hand, can slightly improve its position in the seat projection. While the German Grüne are still in the doldrums, the Greens are benefiting from Sumar’s rapprochement in Spain. In addition, the Danish SF has been able to position itself as an alternative to the unpopular national grand coalition and would now be the second largest force in the country. In total, the Greens/EFA would reach 45 seats (+2, dynamic scenario: 47).
Surging ID
But the real winner in recent weeks has clearly been the far-right ID group. The most politically radical grouping in the European Parliament has experienced a massive surge, mainly due to the success of the PVV in the Netherlands, but gaining ground also in Germany, France, Belgium and Portugal. This brings the ID to a total of 89 seats (+13), overtaking the Liberals for the first time as the third largest group in the Parliament. In the dynamic scenario, which assumes that also the Hungarian governing party Fidesz will join the ID, the gains are even more significant. Here, the ID would reach 108 seats, almost twice as many as in the current parliament.
With this surge, the ID also leaves the other right-wing group in the European Parliament, the ECR, far behind. The ECR’s recent performance in Poland and Romania has been weaker than before, leaving them with only 75 seats (–3, dynamic scenario: 85). Compared to the current parliament, however, would still mean an enormous increase of the group’s strength.
Non-attached and “other” parties
In addition, the (mostly also right-wing) non-attached parties – such as Hungary’s Fidesz and France’s Reconquête – also make gains in the current projection. The neo-fascist Republika from Slovakia and the populist DP from Lithuania would also win one seat each now. In total, the baseline scenario has the non-attached parties at 43 seats (+5), while in the dynamic scenario (in which Fidesz joins the ID and Reconquête enters the ECR) they reach 34 seats.
Finally, there are the “other” parties, which are currently not represented in the Parliament and cannot be clearly assigned to any political group. Among them, the far-right parties Konfederacja from Poland and DD from Denmark could recently improve in the polls. The centre-left LRP from Lithuania, the ECR-friendly ITN from Bulgaria and the neo-fascist ELAM from Cyprus would now also win one seat each. No reliable polls have yet been published for Sahra Wagenknecht’s new party in Germany, so it is not included in the projection.
On the other hand, several other parties, such as the Dutch NSC and BBB, the Bulgarian PP and the Slovak Hlas, all fared worse now than in November. Overall, the “other” parties therefore fall back to 30 seats in the baseline scenario (–6). In the dynamic scenario, all “other” parties are assigned to one of the existing parliamentary groups or to the non-attached members.
The centre-left lacks a majority, but so does the centre-right
The weakness of the centre-left parties and the rise of the far right also has an impact on the options for forming a majority in the European Parliament and for the EU institutions as a whole. The centre-left alliance of S&D, RE, G/EFA and the Left – which was responsible for some important decisions in the last legislative period, especially on climate policy – would now be far from a majority on its own (dynamic scenario: 316 out of 720 seats). Without the support of a significant number of dissenters from other groups and/or non-attached MEPs, the parties to the left of the EPP would no longer be able to push through any decisions in the Parliament.
In principle, this strengthens the EPP’s negotiating position when it comes to forming parliamentary majorities. However, due to the decline of the Liberals and the surge of the ID, the most plausible coalition to the right of the Socialists – a centre-right alliance of EPP, RE and ECR – would currently not have a majority either (dynamic scenario: 353 of 720 seats). Not to mention the fact that the Liberals are very sceptical about such an alliance and certainly don’t want to formalise it in any way.
Democratic majorities are only possible with the grand coalition
Thus, a right-wing majority in the Parliament would only be possible if the EPP and ECR open up to cooperating with the ID (dynamic scenario: 370 out of 720 seats). Otherwise, the main remaining majority option is ultimately the “eternal grand coalition” of EPP, S&D and RE, which has always been responsible for most decisions in the European Parliament in the past (dynamic scenario: 411 of 720 seats, including also the Greens/EFA: 458 of 720 seats).
After the elections, the EPP will therefore hold the key to the next legislature: Will it follow the European shift to the right and tear down the “cordon sanitaire” that has so far separated the democratic parties from the far right? Or will it remain in the democratic centre and align itself even more tightly with the Socialists and Liberals? In the latter case, the strength of the far right could bring the EPP and S&D even closer together than before, as both groups will know that they cannot form democratic majorities without each other.
In any case, as long as the EPP is willing, the democratic parties will still be able to reliably outvote the far-right parties and keep them out of power in the next parliamentary term. Although the combined number of seats of the “eternal grand coalition” will fall to a historic low, it will still be enough for a solid majority. The cordon sanitaire is only a matter of political will – at least in the European Parliament.
No cordon sanitaire in the Council
The situation is different in the Council of the EU, which is at least on an equal footing with the Parliament in all European decision-making processes. In the Council, important decisions are taken either unanimously or by qualified majority (i.e. with the support of at least 55% of the governments representing at least 65% of the European population).
Thus, a party can achieve a blocking minority if it is part of the national government in at least 13 member states – or in countries representing at least 35% of the EU population. Far-right parties are still some way from achieving this: ECR member parties are currently in government in Italy (FdI), the Czech Republic (ODS) and Finland (PS), while the ID has ministers in Italy (Lega) and parties close to it are in government in Hungary (Fidesz) and Slovakia (SNS). In total, therefore, far-right parties are represented in five EU governments, representing just over 20% of the population.
In practice, however, the Council does not vote along party lines but seeks the broadest possible consensus among member states, which means that there is no meaningful cordon sanitaire anyway. Already now, right-wing parties have more influence on European policy through the Council than through the Parliament. If further governments with ID participation come to power in the coming months – for example in the Netherlands (PVV) or in Austria (FPÖ) – this development will become even more pronounced.
Consensus procedures as an opening for the far right
Europe is tilting to the right, and the media will certainly use the European elections, with the expected strong gains of the ECR and ID, as a focal point to discuss this development in 2024. But amidst all the agitation, it should not be forgotten that the Parliament, with its democratic majority voting procedures, is actually the EU institution that is best equipped to deal with the far-right challenge.
What really gives far-right parties an opening to influence European policy is the Council, where they can gradually expand their position with each national government in which they participate. Not supranational democracy, but supposedly sovereignty-preserving consensus procedures are the way far-right parties are gaining power over European legislation, even as the vast majority of European citizens continue to support the democratic centre.
The overview
The following table breaks down the distribution of seats in the projection by individual national parties. The table follows the baseline scenario, in which each national party is attributed to its current parliamentary group (or to the parliamentary group of its European political party) and parties without a clear attribution are labelled as “other”.
In contrast, the dynamic scenario of the seat projection assigns each “other” party to the parliamentary group to which it is politically closest, and also takes into account other possible future group changes of individual national parties. In the table, the changes in the dynamic scenario compared to the baseline scenario are indicated by a coloured font and a mouseover text.
In the absence of pan-European election polls, the projection is based on an aggregation of national polls and election results from all member states. The specific data basis for each country is explained in the small print below the table. For more information on European parties and political groups in the European Parliament, click here.
| Left | G/EFA | S&D | RE | EPP | ECR | ID | NI | other | |
| EP today | 37 | 72 | 141 | 101 | 178 | 66 | 60 | 50 | – |
| Sept. 23 | 43 | 46 | 147 | 91 | 162 | 77 | 74 | 37 | 43 |
| Nov. 23 | 43 | 43 | 137 | 90 | 170 | 78 | 76 | 38 | 45 |
| dynamic | 46 | 47 | 138 | 96 | 178 | 89 | 92 | 34 | – |
| Left | G/EFA | S&D | RE | EPP | ECR | ID | NI | other | |
| DE | 3 Linke | 12 Grüne 1 Piraten 1 ÖDP 1 Volt |
14 SPD | 5 FDP 3 FW |
30 Union 1 Familie |
22 AfD | 2 Partei | 1 Tier | |
| FR | 6 LFI |
7 EELV | 9 PS | 18 Ens | 8 LR | 27 RN | 6 Rec |
||
| IT | 16 PD | 6 Az-+EU |
6 FI 1 SVP |
25 FdI | 8 Lega | 14 M5S | |||
| ES | 2 Sumar 1 Podemos 1 Bildu |
4 Sumar 1 ERC |
20 PSOE | 24 PP | 7 Vox | 1 Junts |
|||
| PL | 5 Lewica | 3 PL2050 |
18 KO 2 KP |
20 PiS | 5 Konf | ||||
| RO | 14 PSD | 6 USR |
7 PNL 2 UDMR |
4 AUR | |||||
| NL | 3 GL | 3 PvdA |
4 VVD 2 D66 |
12 PVV |
5 NSC 2 BBB |
||||
| BE | 2 PTB |
1 Groen 1 Ecolo |
2 Vooruit 3 PS |
1 O-VLD 2 MR |
1 CD&V 1 LE 1 CSP |
3 N-VA | 4 VB | ||
| CZ | 3 Piráti |
9 ANO |
1 STAN 1 TOP09 |
4 ODS | 3 SPD | ||||
| EL | 3 Syriza | 3 PASOK | 9 ND | 1 EL | 2 KKE | 1 PE 1 NIKI 1 Spart |
|||
| HU | 5 DK 1 MSZP |
2 MM | 1 KDNP | 12 Fidesz |
|
||||
| PT |
2 BE |
8 PS | 1 IL | 6 PSD | 4 CH | ||||
| SE | 2 V | 1 MP | 9 S | 4 M | 5 SD | ||||
| AT | 2 Grüne | 5 SPÖ | 2 Neos | 4 ÖVP | 7 FPÖ | ||||
| BG | 2 BSP | 3 DPS | 5 GERB |
3 PP-DB 3 V 1 ITN |
|||||
| DK | 1 Enhl. | 3 SF | 4 S | 1 V 2 LA 1 M |
1 K | 2 DD | |||
| SK | 3 PS |
1 OĽANO 1 D 1 KDH |
1 SASKA | 4 Smer 1 REP |
2 Hlas 1 SNS |
||||
| FI | 1 Vas | 1 Vihreät | 4 SDP | 2 Kesk | 4 Kok | 3 PS | |||
| IE | 6 SF | 3 FF | 4 FG | 1 SD |
|||||
| HR | 3 SDP | 6 HDZ |
1 Možemo 1 Most 1 DP |
||||||
| LT | 2 LVŽS | 3 LSDP | 1 LRLS |
2 TS-LKD | 1 DP |
1 DSVL 1 LRP |
|||
| LV | 1 Prog |
2 JV |
2 NA |
2 ZZS 1 LRA 1 S! |
|||||
| SI | 1 Levica | 1 SD | 3 GS |
4 SDS |
|||||
| EE | 1 SDE |
1 RE 1 KE |
2 Isamaa | 2 EKRE | |||||
| CY | 2 AKEL |
1 DIKO |
2 DISY | 1 ELAM | |||||
| LU | 2 LSAP | 1 DP | 3 CSV | ||||||
| MT | 3 PL | 3 PN |
| Left | G/EFA | S&D | RE | EPP | ECR | ID | NI | other | |
| 08/01/2024 | 33 | 45 | 141 | 86 | 169 | 75 | 89 | 43 | 39 |
| 06/11/2023 | 43 | 43 | 137 | 90 | 170 | 78 | 76 | 38 | 45 |
| 11/09/2023 | 42+1 | 46 | 144+3 | 90+1 | 157+5 | 77 | 72+2 | 36+1 | 41+2 |
| 17/07/2023 | 41 | 48 | 136 | 94 | 160 | 79 | 70 | 36 | 41 |
| 22/05/2023 | 49 | 50 | 137 | 92 | 162 | 79 | 67 | 33 | 36 |
| 27/03/2023 | 44 | 42 | 137 | 94 | 162 | 78 | 68 | 38 | 42 |
| 01/02/2023 | 50 | 42 | 135 | 96 | 168 | 78 | 65 | 37 | 34 |
| 06/12/2022 | 51 | 44 | 136 | 93 | 166 | 79 | 64 | 37 | 35 |
| 12/10/2022 | 52 | 42 | 127 | 100 | 169 | 79 | 63 | 35 | 38 |
| 20/08/2022 | 52 | 47 | 134 | 98 | 170 | 75 | 63 | 27 | 39 |
| 22/06/2022 | 54 | 44 | 133 | 101 | 165 | 77 | 64 | 31 | 36 |
| 25/04/2022 | 59 | 39 | 139 | 97 | 157 | 78 | 64 | 38 | 34 |
| 01/03/2022 | 53 | 36 | 139 | 98 | 158 | 78 | 62 | 45 | 36 |
| 04/01/2022 | 51 | 39 | 142 | 99 | 165 | 73 | 62 | 34 | 40 |
| 08/11/2021 | 50 | 42 | 144 | 96 | 155 | 75 | 72 | 36 | 35 |
| 13/09/2021 | 54 | 42 | 141 | 98 | 160 | 70 | 75 | 33 | 32 |
| 21/07/2021 | 52 | 45 | 133 | 97 | 167 | 71 | 74 | 31 | 35 |
| 24/05/2021 | 50 | 50 | 125 | 95 | 167 | 74 | 73 | 33 | 38 |
| 29/03/2021 | 52 | 46 | 136 | 96 | 164 | 71 | 73 | 34 | 33 |
| 02/02/2021 | 52 | 45 | 135 | 94 | 184 | 70 | 71 | 21 | 33 |
| 09/12/2020 | 52 | 47 | 136 | 93 | 188 | 67 | 73 | 20 | 29 |
| 12/10/2020 | 51 | 49 | 127 | 96 | 193 | 67 | 71 | 21 | 30 |
| 14/08/2020 | 50 | 53 | 145 | 88 | 196 | 65 | 64 | 20 | 24 |
| 25/06/2020 | 48 | 55 | 143 | 91 | 203 | 64 | 63 | 20 | 18 |
| 26/04/2020 | 47 | 53 | 151 | 88 | 202 | 66 | 66 | 19 | 13 |
| 10/03/2020 | 51 | 58 | 138 | 88 | 188 | 67 | 82 | 21 | 12 |
| 09/01/2020 | 49 | 58 | 135 | 93 | 186 | 65 | 82 | 24 | 13 |
| 23/11/2019 | 48 | 57 | 138 | 99 | 181 | 62 | 82 | 22 | 16 |
| 23/09/2019 | 49 | 61 | 139 | 108 | 175 | 56 | 82 | 24 | 11 |
| 30/07/2019 | 47 | 64 | 138 | 108 | 180 | 57 | 82 | 22 | 7 |
| EP 2019 | 40 | 68 | 148 | 97 | 187 | 62 | 76 | 27 | – |
The “EP 2019” line indicates the distribution of seats as of July 2, 2019, when the European Parliament was constituted following the election in May 2019.
The table shows the values of the baseline scenario without the United Kingdom. Until September 2023, the seat projection is based on 705 seats, thereafter on 720 seats. In the figures for September 2023, the transition is marked by superscript numbers.
For countries where there are no specific European election polls or where the last such poll was taken more than a fortnight ago, the most recent poll available for the national parliamentary election or the average of all polls for the national or European Parliament from the two weeks preceding the most recent poll available is used instead. For countries where there are no recent polls for parliamentary elections, polls for presidential elections may be used instead, with the presidential candidates’ polling figures assigned to their respective parties (this concerns France and Cyprus in particular). For member states for which no recent polls can be found at all, the results of the last national or European elections are used.
As a rule, the national poll results of the parties are directly converted to the total number of seats in the country. For countries where the election is held in regional constituencies without proportional representation (currently Belgium and Ireland), regional polling data is used where available. Where this is not the case, the number of seats is still calculated for each constituency individually, but using the overall national polling data in each case. National electoral thresholds are taken into account in the projection where they exist.
In Belgium, constituencies in the European election correspond to language communities, while polls are usually conducted at the regional level. The projection uses polling data from Wallonia for the French-speaking community and polling data from Flanders for the Dutch-speaking community. For the German-speaking community, it uses the result of the last European election (1 seat for CSP).
In countries where it is common for several parties to run as an electoral alliance on a common list, the projection makes a plausibility assumption about the composition of these lists. In the table, such multi-party lists are usually grouped under the name of the electoral alliance or of its best-known member party. Sometimes, however, the parties of an electoral alliance split up after the election and join different political groups in the European Parliament. In this case, the parties are listed individually and a plausibility assumption is made about the distribution of seats on the joint list. This concerns the following parties: Italy: SI (place 1 and 3 on the list) and EV (2, 4); Spain: ERC (1, 3-4), Bildu (2) and BNG (5); PNV (1) and CC (2); Poland: PL2050 (1, 3, 5 etc.) and KP (2, 4, 6 etc.); Netherlands: GL (1, 3, 5 etc.) and PvdA (2, 4, 6 etc.); Hungary: Fidesz (1-6, from 8) and KDNP (7); Slovakia: PS (1) and D (2).
In the Czech Republic, ODS, TOP09 and KDU-ČSL run on a joint list in the European election, but appear separately in national polls. The seat projection assigns each of the three parties the number of seats they would win individually, but disregards the national electoral threshold clause for them.
In Spain, it is assumed that among the members of Sumar, two thirds will join the Greens/EFA and one third will join the Left group.
In France, several centre-left parties (LFI, PS, EELV, PCF) have joined forces to form the electoral alliance NUPES for the 2022 national parliamentary election. However, it is unlikely that this alliance will last in the next European election. In the projection, the poll ratings or electoral results of the alliance are therefore divided among the individual parties according to the ratio of the average poll ratings of the parties in the most recent polls that showed them individually.
Since there is no electoral threshold for European elections in Germany, parties can win a seat in the European Parliament with less than 1 per cent of the vote. Since German polling institutes do not usually report values for very small parties, the projection includes them based on their results at the last European election (2 seats each for PARTEI and FW, 1 seat each for Tierschutzpartei, ödp, Piraten, Volt and Familienpartei). Only if a small party achieves a better value in current polls than in the last European election, the poll rating is used instead.
In Italy, a special rule makes it easier for minority parties to enter the European Parliament. In the projection, the Südtiroler Volkspartei is therefore always listed with its result in the last European election (1 seat).
France: European election polls, 11-14/12/2023, source: Wikipedia.
Italy: national polls, 2-8/1/2024, source: Wikipedia.
Spain: national polls, 26/12/2023-5/1/2024, source: Wikipedia.
Poland: national polls, 6-17/12/2023, source: Wikipedia.
Romania: national polls, 28/12/2023, source: Wikipedia.
Netherlands: national polls, 11-22/12/2023, source: Wikipedia.
Belgium, Dutch-speaking community: regional polls (Flanders) for the national parliamentary election, 28/11-11/12/2023, source: Wikipedia.
Belgium, French-speaking community: regional polls (Wallonie) for the national parliamentary election, 11/12/2023, source: Wikipedia.
Belgium, German-speaking community: results of the European election, 26/5/2019.
Czech Republic: national polls, November 2023, source: Wikipedia.
Greece: national polls, 28/12/2023-5/1/2024, source: Wikipedia.
Hungary: national polls, 15/12/2023, source: Wikipedia.
Portugal: national polls, 20-23/12/2023, source: Wikipedia.
Sweden: national polls, 2/1/2024, source: Wikipedia.
Austria: national polls, 21-27/12/2023, source: Wikipedia.
Bulgaria: national polls, 13/12/2023, source: Wikipedia.
Denmark: national polls, 13-22/12/2023, source: Wikipedia.
Slowakei: national polls, 13-18/12/2023, source: Wikipedia.
Finland: national polls, 2/1/2024, source: Wikipedia.
Ireland: national polls, 6/1/2024, source: Wikipedia.
Croatia: national polls, 10-22/12/2023, source: Wikipedia.
Lithuania: national polls, 27/11-2/12/2023, source: Wikipedia.
Latvia: national polls, December 2023, source: Wikipedia.
Slovenia: national polls, 14-21/12/2023, source: Wikipedia.
Estonia: national polls, 13-22/12/2023, source: Wikipedia.
Cyprus: national polls, 22/9/2023, source: Europe Elects.
Luxembourg: results of the national parliamentary election, 8/10/2023, source: Wikipedia.
Malta: national polls, 6/12/2023, source: Wikipedia.
Correction note, 12 January: Due to a transcription error, an earlier version of this article contained incorrect figures for Forza Italia (Italy), SASKA and Republika (both Slovakia) in the overview table. The figures have been corrected.
Why is there no difference in the elections results of the S&D in the bar chart, while there is a huge difference in the pie chart and in your text?
AntwortenLöschenThere are no big differences. As you can see in the table and the text, the S&D currently has 141 seats in the EP and would also have 141 seats according to the baseline projection (143 according to the dynamic projection). However, the overall number of EP seats will increase from 705 to 720, meaning that the same seat *number* (bar chart) will correspond to a slightly lower seat *share* (pie chart).
AntwortenLöschen