11 Januar 2024

European Parliament seat projection (January 2024): Left and Liberals lose, far-right ID group becomes third largest force

By Manuel Müller


Left G/EFA S&D RE EPP ECR ID NI other
EP today3871141101178675851
Nov. 2343431379017078763845
Jan. 2433451418616975894339
dynamic3547143911778510834
Baseline scenario,
as of 08/01/2024.

 
Dynamic scenario,
as of 08/01/2024.

At the start of the European election year, many of the trends that have been emerging in recent months are intensifying: Compared with the seat projection for November 2023, the centre-left camp continues to lose ground – this time because the liberal RE group and, above all, the Left group are in decline –, whereas the far-right camp, or more precisely the ID group, makes further gains, overtaking the Liberals to become the third strongest force in the projection. Meanwhile, there is little change for the two largest groups in the Parliament: The socialist S&D group slightly improves its position, but the centre-right EPP retains a comfortable lead.

Few changes for EPP and S&D

For the European People’s Party, the election year begins with no major changes. The members of the large centre-right group have recently made slight gains in German and French polls, but have lost ground in Poland and a few other countries. Overall, they now have 169 seats in the baseline scenario (–⁠1 compared to November). In the dynamic scenario, which also takes into account the possibility of new member parties joining the group, the EPP reaches 177 seats. It benefits in particular from its popularity in the Netherlands, where two newcomer parties – the centre-right NSC and the agrarian populist BBB – both see their future in the EPP.

The Socialists, on the other hand, continue to lose ground in Germany, but are improving in Poland, Hungary and Portugal, among other countries, and would now reach a total of 141 seats (+4). In the dynamic scenario the figure is only slightly better (143 seats). As a result, both the S&D and the EPP would roughly maintain the number of seats that they already have in the current parliament.

Weakened RE

Meanwhile, the RE group has suffered significant losses in recent weeks. The Liberals were particularly shaken by the aftermath of the Dutch general election in November, in which the liberal VVD party, which had led the Dutch government since 2010, came in third behind the far-right PVV (ID) and the red-green alliance between the PvdA (S&D) and GroenLinks (G/EFA). After the election, the VVD fell even further in the polls. Beyond that, RE also lost ground in other countries such as Portugal and Sweden, while making small gains in Italy, Poland, and Romania.

All in all, this leaves the Liberals with just 86 seats (–⁠4) – their worst projected result since the rise of Emmanuel Macron’s LREM in the summer of 2017. The dynamic scenario is only slightly better: Here, the RE group stands at 91 seats, its worst figure since spring 2020.

Plummeting Left

Meanwhile, the Left group is losing even more, plummeting to 33 seats (–⁠10, dynamic scenario: 35), its worst projected result since regular seat projections began in 2014. This is particularly due to France, where the main left-wing party LFI is increasingly isolated and has lost much support because of its ambivalent stance on antisemitism, while the smaller PCF has slipped below the five-percent threshold in the polls.

But the Left has also weakened recently in the Netherlands, Belgium and Portugal. Moreover, in Spain the left-wing Podemos party has split from the left-green alliance Sumar, meaning that Sumar is now dominated by parties with a Green orientation – while Podemos itself is only a shadow of its former strength in the polls. In Germany, on the other hand, former Linke leader Sahra Wagenknecht has recently founded a new party which will compete with the Left and whose future group membership in the European Parliament remains a matter of speculation. The decline of the Left is taking place amid internal disputes and divisions, which the European Left is struggling to contain.

The Greens/EFA group, on the other hand, can slightly improve its position in the seat projection. While the German Grüne are still in the doldrums, the Greens are benefiting from Sumar’s rapprochement in Spain. In addition, the Danish SF has been able to position itself as an alternative to the unpopular national grand coalition and would now be the second largest force in the country. In total, the Greens/EFA would reach 45 seats (+⁠2, dynamic scenario: 47).

Surging ID

But the real winner in recent weeks has clearly been the far-right ID group. The most politically radical grouping in the European Parliament has experienced a massive surge, mainly due to the success of the PVV in the Netherlands, but gaining ground also in Germany, France, Belgium and Portugal. This brings the ID to a total of 89 seats (+⁠13), overtaking the Liberals for the first time as the third largest group in the Parliament. In the dynamic scenario, which assumes that also the Hungarian governing party Fidesz will join the ID, the gains are even more significant. Here, the ID would reach 108 seats, almost twice as many as in the current parliament.

With this surge, the ID also leaves the other right-wing group in the European Parliament, the ECR, far behind. The ECR’s recent performance in Poland and Romania has been weaker than before, leaving them with only 75 seats (–⁠3, dynamic scenario: 85). Compared to the current parliament, however, would still mean an enormous increase of the group’s strength.

Non-attached and “other” parties

In addition, the (mostly also right-wing) non-attached parties – such as Hungary’s Fidesz and France’s Reconquête – also make gains in the current projection. The neo-fascist Republika from Slovakia and the populist DP from Lithuania would also win one seat each now. In total, the baseline scenario has the non-attached parties at 43 seats (+⁠5), while in the dynamic scenario (in which Fidesz joins the ID and Reconquête enters the ECR) they reach 34 seats.

Finally, there are the “other” parties, which are currently not represented in the Parliament and cannot be clearly assigned to any political group. Among them, the far-right parties Konfederacja from Poland and DD from Denmark could recently improve in the polls. The centre-left LRP from Lithuania, the ECR-friendly ITN from Bulgaria and the neo-fascist ELAM from Cyprus would now also win one seat each. No reliable polls have yet been published for Sahra Wagenknecht’s new party in Germany, so it is not included in the projection.

On the other hand, several other parties, such as the Dutch NSC and BBB, the Bulgarian PP and the Slovak Hlas, all fared worse now than in November. Overall, the “other” parties therefore fall back to 30 seats in the baseline scenario (–⁠6). In the dynamic scenario, all “other” parties are assigned to one of the existing parliamentary groups or to the non-attached members.

The centre-left lacks a majority, but so does the centre-right

The weakness of the centre-left parties and the rise of the far right also has an impact on the options for forming a majority in the European Parliament and for the EU institutions as a whole. The centre-left alliance of S&D, RE, G/EFA and the Left – which was responsible for some important decisions in the last legislative period, especially on climate policy – would now be far from a majority on its own (dynamic scenario: 316 out of 720 seats). Without the support of a significant number of dissenters from other groups and/or non-attached MEPs, the parties to the left of the EPP would no longer be able to push through any decisions in the Parliament.

In principle, this strengthens the EPP’s negotiating position when it comes to forming parliamentary majorities. However, due to the decline of the Liberals and the surge of the ID, the most plausible coalition to the right of the Socialists – a centre-right alliance of EPP, RE and ECR – would currently not have a majority either (dynamic scenario: 353 of 720 seats). Not to mention the fact that the Liberals are very sceptical about such an alliance and certainly don’t want to formalise it in any way.

Democratic majorities are only possible with the grand coalition

Thus, a right-wing majority in the Parliament would only be possible if the EPP and ECR open up to cooperating with the ID (dynamic scenario: 370 out of 720 seats). Otherwise, the main remaining majority option is ultimately the “eternal grand coalition” of EPP, S&D and RE, which has always been responsible for most decisions in the European Parliament in the past (dynamic scenario: 411 of 720 seats, including also the Greens/EFA: 458 of 720 seats).

After the elections, the EPP will therefore hold the key to the next legislature: Will it follow the European shift to the right and tear down the “cordon sanitaire” that has so far separated the democratic parties from the far right? Or will it remain in the democratic centre and align itself even more tightly with the Socialists and Liberals? In the latter case, the strength of the far right could bring the EPP and S&D even closer together than before, as both groups will know that they cannot form democratic majorities without each other.

In any case, as long as the EPP is willing, the democratic parties will still be able to reliably outvote the far-right parties and keep them out of power in the next parliamentary term. Although the combined number of seats of the “eternal grand coalition” will fall to a historic low, it will still be enough for a solid majority. The cordon sanitaire is only a matter of political will – at least in the European Parliament.

No cordon sanitaire in the Council

The situation is different in the Council of the EU, which is at least on an equal footing with the Parliament in all European decision-making processes. In the Council, important decisions are taken either unanimously or by qualified majority (i.e. with the support of at least 55% of the governments representing at least 65% of the European population).

Thus, a party can achieve a blocking minority if it is part of the national government in at least 13 member states – or in countries representing at least 35% of the EU population. Far-right parties are still some way from achieving this: ECR member parties are currently in government in Italy (FdI), the Czech Republic (ODS) and Finland (PS), while the ID has ministers in Italy (Lega) and parties close to it are in government in Hungary (Fidesz) and Slovakia (SNS). In total, therefore, far-right parties are represented in five EU governments, representing just over 20% of the population.

In practice, however, the Council does not vote along party lines but seeks the broadest possible consensus among member states, which means that there is no meaningful cordon sanitaire anyway. Already now, right-wing parties have more influence on European policy through the Council than through the Parliament. If further governments with ID participation come to power in the coming months – for example in the Netherlands (PVV) or in Austria (FPÖ) – this development will become even more pronounced.

Consensus procedures as an opening for the far right

Europe is tilting to the right, and the media will certainly use the European elections, with the expected strong gains of the ECR and ID, as a focal point to discuss this development in 2024. But amidst all the agitation, it should not be forgotten that the Parliament, with its democratic majority voting procedures, is actually the EU institution that is best equipped to deal with the far-right challenge.

What really gives far-right parties an opening to influence European policy is the Council, where they can gradually expand their position with each national government in which they participate. Not supranational democracy, but supposedly sovereignty-preserving consensus procedures are the way far-right parties are gaining power over European legislation, even as the vast majority of European citizens continue to support the democratic centre.

The overview

The following table breaks down the distribution of seats in the projection by individual national parties. The table follows the baseline scenario, in which each national party is attributed to its current parliamentary group (or to the parliamentary group of its European political party) and parties without a clear attribution are labelled as “other”.

In contrast, the dynamic scenario of the seat projection assigns each “other” party to the parliamentary group to which it is politically closest, and also takes into account other possible future group changes of individual national parties. In the table, the changes in the dynamic scenario compared to the baseline scenario are indicated by a coloured font and a mouseover text.

In the absence of pan-European election polls, the projection is based on an aggregation of national polls and election results from all member states. The specific data basis for each country is explained in the small print below the table. For more information on European parties and political groups in the European Parliament, click here.


Left G/EFA S&D RE EPP ECR ID NI other
EP today3772141101178666050
Sept. 2343461479116277743743
Nov. 2343431379017078763845
dynamic464713896178899234

Left G/EFA S&D RE EPP ECR ID NI other
DE 3 Linke 12 Grüne
1 Piraten
1 ÖDP
1 Volt
14 SPD 5 FDP
3 FW
30 Union
1 Familie

22 AfD 2 Partei 1 Tier
FR 6 LFI
7 EELV 9 PS 18 Ens 8 LR
27 RN 6 Rec

IT

16 PD 6 Az-+EU 6 FI
1 SVP
25 FdI 8 Lega 14 M5S
ES 2 Sumar
1 Podemos
1 Bildu
4 Sumar
1 ERC
20 PSOE
24 PP 7 Vox
1 Junts

PL

5 Lewica 3 PL2050
18 KO
2 KP
20 PiS

5 Konf
RO

14 PSD 6 USR 7 PNL
2 UDMR
4 AUR


NL
3 GL 3 PvdA 4 VVD
2 D66


12 PVV
5 NSC
2 BBB
BE 2 PTB 1 Groen
1 Ecolo
2 Vooruit
3 PS
1 O-VLD
2 MR
1 CD&V
1 LE
1 CSP
3 N-VA 4 VB

CZ
3 Piráti

9 ANO 1 STAN
1 TOP09
4 ODS 3 SPD

EL 3 Syriza
3 PASOK
9 ND 1 EL
2 KKE 1 PE
1 NIKI
1 Spart
HU

5 DK
1 MSZP
2 MM 1 KDNP

12 Fidesz
PT 2 BE

8 PS 1 IL 6 PSD
4 CH

SE 2 V 1 MP 9 S
4 M 5 SD


AT
2 Grüne 5 SPÖ 2 Neos 4 ÖVP
7 FPÖ

BG

2 BSP 3 DPS 5 GERB


3 PP-DB
3 V
1 ITN
DK 1 Enhl. 3 SF 4 S 1 V
2 LA
1 M
1 K


2 DD
SK


3 PS 1 OĽANO
1 D
1 KDH
1 SASKA
4 Smer
1 REP
2 Hlas
1 SNS
FI 1 Vas 1 Vihreät 4 SDP 2 Kesk 4 Kok 3 PS


IE 6 SF

3 FF 4 FG


1 SD
HR

3 SDP
6 HDZ


1 Možemo
1 Most
1 DP
LT
2 LVŽS 3 LSDP 1 LRLS
2 TS-LKD

1 DP 1 DSVL
1 LRP
LV
1 Prog


2 JV
2 NA

2 ZZS
1 LRA
1 S!
SI 1 Levica
1 SD 3 GS 4 SDS


EE

1 SDE 1 RE
1 KE
2 Isamaa
2 EKRE

CY 2 AKEL
1 DIKO

2 DISY


1 ELAM
LU

2 LSAP 1 DP 3 CSV


MT

3 PL
3 PN


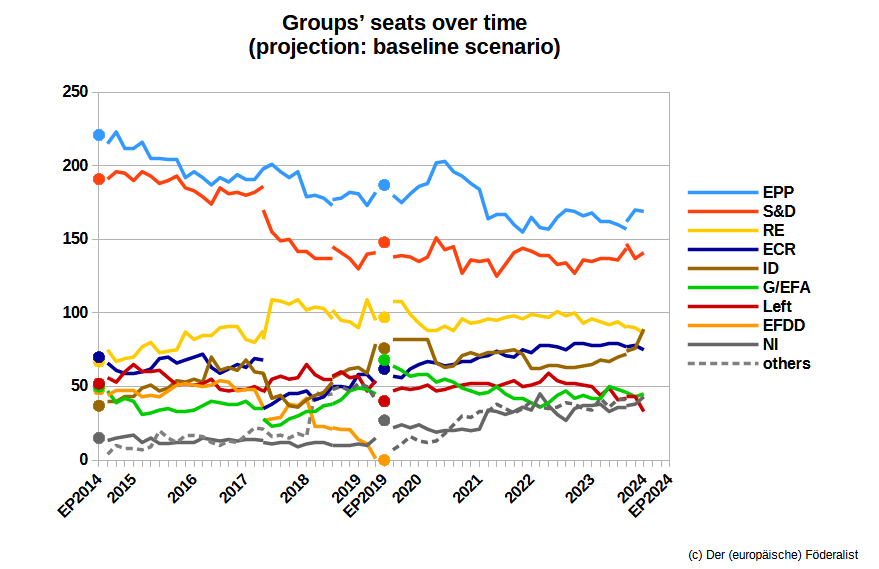
Timeline (baseline scenario)


Left G/EFA S&D RE EPP ECR ID NI other
08/01/2024 33 45 141 86 169 75 89 43 39
06/11/2023 43 43 137 90 170 78 76 38 45
11/09/2023 42+1 46 144+3 90+1 157+5 77 72+2 36+1 41+2
17/07/2023 41 48 136 94 160 79 70 36 41
22/05/2023 49 50 137 92 162 79 67 33 36
27/03/2023 44 42 137 94 162 78 68 38 42
01/02/2023 50 42 135 96 168 78 65 37 34
06/12/2022 51 44 136 93 166 79 64 37 35
12/10/2022 52 42 127 100 169 79 63 35 38
20/08/2022 52 47 134 98 170 75 63 27 39
22/06/2022 54 44 133 101 165 77 64 31 36
25/04/2022 59 39 139 97 157 78 64 38 34
01/03/2022 53 36 139 98 158 78 62 45 36
04/01/2022 51 39 142 99 165 73 62 34 40
08/11/2021 50 42 144 96 155 75 72 36 35
13/09/2021 54 42 141 98 160 70 75 33 32
21/07/2021 52 45 133 97 167 71 74 31 35
24/05/2021 50 50 125 95 167 74 73 33 38
29/03/2021 52 46 136 96 164 71 73 34 33
02/02/2021 52 45 135 94 184 70 71 21 33
09/12/2020 52 47 136 93 188 67 73 20 29
12/10/2020 51 49 127 96 193 67 71 21 30
14/08/2020 50 53 145 88 196 65 64 20 24
25/06/2020 48 55 143 91 203 64 63 20 18
26/04/2020 47 53 151 88 202 66 66 19 13
10/03/2020 51 58 138 88 188 67 82 21 12
09/01/2020 49 58 135 93 186 65 82 24 13
23/11/2019 48 57 138 99 181 62 82 22 16
23/09/2019 49 61 139 108 175 56 82 24 11
30/07/2019 47 64 138 108 180 57 82 22 7
EP 2019 40 68 148 97 187 62 76 27

The “EP 2019” line indicates the distribution of seats as of July 2, 2019, when the European Parliament was constituted following the election in May 2019.
The table shows the values of the baseline scenario without the United Kingdom. Until September 2023, the seat projection is based on 705 seats, thereafter on 720 seats. In the figures for September 2023, the transition is marked by superscript numbers.
An overview of the values including the United Kingdom for the period up to January 2020 can be found here. An overview of older projections from the 2014-2019 electoral period is here.
 
The full names of the parliamentary groups and of the national parties appear as mouseover text when the mouse pointer is held motionless on the designation in the table for a short time. If a party is attributed to a different parliamentary group in the dynamic scenario than in the baseline scenario, this is also indicated in the mouseover text.

Attribution of national parties to parliamentary groups

Baseline scenario: For the projection, parties that are already represented in the European Parliament are assigned to their current parliamentary group, unless they have explicitly declared that they will change group after the next European election. National parties that are not currently represented in the European Parliament, but belong to a European political party, are attributed to the parliamentary group of that party. In cases where the members of a national electoral list are expected to split up and join different political groups after the election, the projection uses the allocation that seems most plausible in each case (see below). Parties for which the allocation to a specific parliamentary group is unclear are classified as “other” in the baseline scenario.
 
According to the Rules of Procedure of the European Parliament, at least 23 MEPs from at least a quarter of the member states are required to form a parliamentary group. Groupings marked with an asterisk (*) would not currently meet these conditions according to the projection. After the European election, they would therefore have to win over additional MEPs in order to be able to constitute themselves as a parliamentary group.
 
Dynamic scenario: In the dynamic scenario, all “other” parties are assigned to an already existing parliamentary group (or to the group of non-attached members). In addition, the dynamic scenario also takes into account other group changes that appear politically plausible, even if the respective parties have not yet been publicly announced them. To highlight these changes from the baseline scenario, parties that are assigned to a different parliamentary group in the dynamic scenario are marked in the table with the colour of that group; moreover, the name of the group appears in the mouseover text. The attributions in the dynamic scenario are partly based on a subjective assessment of the political orientation and strategy of the parties and can therefore be quite uncertain in detail. From an overall perspective, however, the dynamic scenario may be closer to the real distribution of seats after the next European election than the baseline scenario.

Data source

If available, the most recent poll of voting intentions for the European Parliament is used to calculate the seat distribution for each country. In case that more than one poll has been published, the average of all polls from the two weeks preceding the most recent poll is calculated, taking into account only the most recent poll from each polling institute. The cut-off date for taking a survey into account is the last day of its fieldwork, if known, otherwise the day of its publication.
For countries where there are no specific European election polls or where the last such poll was taken more than a fortnight ago, the most recent poll available for the national parliamentary election or the average of all polls for the national or European Parliament from the two weeks preceding the most recent poll available is used instead. For countries where there are no recent polls for parliamentary elections, polls for presidential elections may be used instead, with the presidential candidates’ polling figures assigned to their respective parties (this concerns France and Cyprus in particular). For member states for which no recent polls can be found at all, the results of the last national or European elections are used.
As a rule, the national poll results of the parties are directly converted to the total number of seats in the country. For countries where the election is held in regional constituencies without proportional representation (currently Belgium and Ireland), regional polling data is used where available. Where this is not the case, the number of seats is still calculated for each constituency individually, but using the overall national polling data in each case. National electoral thresholds are taken into account in the projection where they exist.
In Belgium, constituencies in the European election correspond to language communities, while polls are usually conducted at the regional level. The projection uses polling data from Wallonia for the French-speaking community and polling data from Flanders for the Dutch-speaking community. For the German-speaking community, it uses the result of the last European election (1 seat for CSP).
In countries where it is common for several parties to run as an electoral alliance on a common list, the projection makes a plausibility assumption about the composition of these lists. In the table, such multi-party lists are usually grouped under the name of the electoral alliance or of its best-known member party. Sometimes, however, the parties of an electoral alliance split up after the election and join different political groups in the European Parliament. In this case, the parties are listed individually and a plausibility assumption is made about the distribution of seats on the joint list. This concerns the following parties: Italy: SI (place 1 and 3 on the list) and EV (2, 4); Spain: ERC (1, 3-4), Bildu (2) and BNG (5); PNV (1) and CC (2); Poland: PL2050 (1, 3, 5 etc.) and KP (2, 4, 6 etc.); Netherlands: GL (1, 3, 5 etc.) and PvdA (2, 4, 6 etc.); Hungary: Fidesz (1-6, from 8) and KDNP (7); Slovakia: PS (1) and D (2).
In the Czech Republic, ODS, TOP09 and KDU-ČSL run on a joint list in the European election, but appear separately in national polls. The seat projection assigns each of the three parties the number of seats they would win individually, but disregards the national electoral threshold clause for them.
In Spain, it is assumed that among the members of Sumar, two thirds will join the Greens/EFA and one third will join the Left group.
In France, several centre-left parties (LFI, PS, EELV, PCF) have joined forces to form the electoral alliance NUPES for the 2022 national parliamentary election. However, it is unlikely that this alliance will last in the next European election. In the projection, the poll ratings or electoral results of the alliance are therefore divided among the individual parties according to the ratio of the average poll ratings of the parties in the most recent polls that showed them individually.
Since there is no electoral threshold for European elections in Germany, parties can win a seat in the European Parliament with less than 1 per cent of the vote. Since German polling institutes do not usually report values for very small parties, the projection includes them based on their results at the last European election (2 seats each for PARTEI and FW, 1 seat each for Tierschutzpartei, ödp, Piraten, Volt and Familienpartei). Only if a small party achieves a better value in current polls than in the last European election, the poll rating is used instead.
In Italy, a special rule makes it easier for minority parties to enter the European Parliament. In the projection, the Südtiroler Volkspartei is therefore always listed with its result in the last European election (1 seat).
 
The following overview lists the data source for each member state. The dates refer to the last day of the fieldwork; if this is not known, to the day of publication of the polls:
Germany: national polls, 3-6/1/2024, source: Wikipedia.
France: European election polls, 11-14/12/2023, source: Wikipedia.
Italy: national polls, 2-8/1/2024, source: Wikipedia.
Spain: national polls, 26/12/2023-5/1/2024, source: Wikipedia.
Poland: national polls, 6-17/12/2023, source: Wikipedia.
Romania: national polls, 28/12/2023, source: Wikipedia.
Netherlands: national polls, 11-22/12/2023, source: Wikipedia.
Belgium, Dutch-speaking community: regional polls (Flanders) for the national parliamentary election, 28/11-11/12/2023, source: Wikipedia.
Belgium, French-speaking community: regional polls (Wallonie) for the national parliamentary election, 11/12/2023, source: Wikipedia.
Belgium, German-speaking community: results of the European election, 26/5/2019.
Czech Republic: national polls, November 2023, source: Wikipedia.
Greece: national polls, 28/12/2023-5/1/2024, source: Wikipedia.
Hungary: national polls, 15/12/2023, source: Wikipedia.
Portugal: national polls, 20-23/12/2023, source: Wikipedia.
Sweden: national polls, 2/1/2024, source: Wikipedia.
Austria: national polls, 21-27/12/2023, source: Wikipedia.
Bulgaria: national polls, 13/12/2023, source: Wikipedia.
Denmark: national polls, 13-22/12/2023, source: Wikipedia.
Slowakei: national polls, 13-18/12/2023, source: Wikipedia.
Finland: national polls, 2/1/2024, source: Wikipedia.
Ireland: national polls, 6/1/2024, source: Wikipedia.
Croatia: national polls, 10-22/12/2023, source: Wikipedia.
Lithuania: national polls, 27/11-2/12/2023, source: Wikipedia.
Latvia: national polls, December 2023, source: Wikipedia.
Slovenia: national polls, 14-21/12/2023, source: Wikipedia.
Estonia: national polls, 13-22/12/2023, source: Wikipedia.
Cyprus: national polls, 22/9/2023, source: Europe Elects.
Luxembourg: results of the national parliamentary election, 8/10/2023, source: Wikipedia.
Malta: national polls, 6/12/2023, source: Wikipedia.

Pictures: all graphs: Manuel Müller.
Correction note, 12 January: Due to a transcription error, an earlier version of this article contained incorrect figures for Forza Italia (Italy), SASKA and Republika (both Slovakia) in the overview table. The figures have been corrected.

Wenn an diesem Sonntag Europawahl wäre (Januar 2024): Linke und Liberale verlieren, rechtsextreme ID-Fraktion wäre jetzt drittstärkste Kraft

Von Manuel Müller


Linke G/EFA S&D RE EVP EKR ID fʼlos Sonst.
EP heute3871141101178675851
Nov. 2343431379017078763845
Jan. 2433451418616975894339
dynamisch3547143911778510834
Basis-Szenario,
Stand: 8.1.2024.
 
Dynamisches Szenario,
Stand: 8.1.2024.

Zum Auftakt des Europawahljahrs verschärfen sich viele Entwicklungen, die sich in den letzten Monaten bereits abgezeichnet hatten: Im Vergleich zur Sitzprojektion von November 2023 verliert das Mitte-links-Lager weiter an Boden – diesmal, weil die liberale RE-Fraktion und vor allem die Linksfraktion abstürzen. Massive Zugewinne kann hingegen das Rechtsaußen-Lager verzeichnen, genauer: die rechtsextreme ID-Fraktion, die in der Projektion die Liberalen als drittstärkste Kraft überholt.

Wenig Veränderungen gibt es schließlich bei den beiden größten Fraktionen im Parlament: Die sozialdemokratische S&D-Fraktion kann zwar etwas dazugewinnen, doch die christdemokratisch-konservative EVP behält einen komfortablen Vorsprung.

EVP und S&D kaum verändert

Für die Europäische Volkspartei beginnt das Wahljahr ohne große Veränderungen. In Deutschland und Frankreich konnten die Konservativen zuletzt leicht zulegen, in Polen und einigen anderen Ländern verloren sie leicht. Unter dem Strich stehen sie deshalb nun im Basisszenario bei 169 Sitzen (–⁠1 im Vergleich zu November). Im dynamischen Szenario, das auch mögliche neue Fraktionsbei- und -übertritte berücksichtigt, erreicht die EVP 177 Sitze. Sie profitiert dabei vor allem von ihrer Beliebtheit in den Niederlanden, wo gleich zwei Newcomer-Parteien – die Mitte-rechts-Formation NSC und die agrarpopulistische BBB – ihre Zukunft in der EVP-Fraktion sehen.

Die Sozialdemokrat:innen wiederum schwächeln in Deutschland weiter, gewinnen aber unter anderem in Polen, Ungarn und Portugal dazu. Insgesamt kämen sie damit auf 141 Mandate (+⁠4); im dynamischen Szenario sind es nur geringfügig bessere 143. Sowohl S&D als auch EVP würden damit in etwa die Sitzzahl halten, die sie auch im aktuellen Parlament einnehmen.

RE geschwächt

Deutliche Verluste musste in den letzten Wochen die RE-Fraktion einstecken. Die Liberalen wurden vor allem von den Nachwirkungen der niederländischen Parlamentswahl Ende November erschüttert, bei der die bisherige liberale Regierungspartei VVD nur den dritten Platz hinter der rechtsextremen PVV (ID) und dem rot-grünen Bündnis aus PvdA (S&D) und GroenLinks (G/EFA) erreichte. In den Umfragen nach der Wahl fiel die VVD sogar noch weiter zurück. Aber auch in anderen Ländern wie Portugal oder Schweden büßen die Liberalen in der Projektion Sitze ein. Leicht zulegen können sie hingegen in Italien, Polen und Rumänien.

Unter dem Strich kommen die Liberalen damit nur noch auf 86 Sitze (–⁠4) – ihr schlechtester Wert seit dem Aufstieg von Emmanuel Macrons LREM im Sommer 2017. Nur wenig besser sieht das dynamische Szenario aus: Hier erreicht die RE-Fraktion noch 91 Sitze, der schlechteste Wert seit dem Tief im Frühjahr 2020.

Linke stürzt ab

Noch stärker verliert indessen die Linksfraktion, die mit 33 Sitzen (–⁠10, dynamisches Szenario: 35) auf ihr schwächstes Ergebnis seit Beginn der regelmäßigen Sitzprojektionen 2014 kommt. Einen Einbruch erleben die Linken vor allem in Frankreich, wo sich die große Linkspartei LFI durch ihre ambivalente Haltung zum Antisemitismus seit Beginn des Gaza-Krieges zunehmend isoliert und stark an Zustimmung verloren hat, während der kleinere PCF in den Umfragen ganz unter die Fünf-Prozent-Hürde gerutscht ist.

Aber auch in den Niederlanden, Belgien und Portugal schnitt die Linke zuletzt schwächer ab. Zudem trennte sich in Spanien die linke Podemos von der links-grünen Allianz Sumar, womit innerhalb von Sumar nun die grün orientierten Parteien dominieren – während Podemos selbst in den Umfragen nur noch ein Schatten seiner früheren Stärke ist. In Deutschland wiederum erfolgte diese Woche die Gründung des „Bündnisses Sahra Wagenknecht“ (BSW), das der Linken Konkurrenz macht und dessen künftige Fraktionszugehörigkeit im Europäischen Parlament noch Raum für Spekulationen bietet. Der Absturz der Linken vollzieht sich also unter internen Streitigkeiten und Spaltungen, die die Europäische Linkspartei mit Mühe einzuhegen versucht.

Etwas zulegen kann hingegen die grüne G/EFA-Fraktion. Die Grünen kommen zwar in Deutschland nicht aus ihrem Tief und würden in Portugal nun keinen Sitz mehr gewinnen. Sie profitieren jedoch von der Annäherung der Sumar in Spanien. Außerdem kann sich in Dänemark die links-grüne SF als Alternative zur ungeliebten nationalen Großen Koalition profilieren und wäre nun die zweitstärkste Kraft des Landes. Insgesamt erreicht die G/EFA damit 45 Sitze (+⁠2, dynamisches Szenario: 47).

ID legt stark zu

Die eigentliche Gewinnerin der letzten Wochen ist jedoch sehr deutlich die rechtsextreme ID-Fraktion. Die politisch radikalste Gruppierung im Europäischen Parlament erfährt vor allem durch den Erfolg der PVV in den Niederlanden massiven Aufwind, kann aber auch in Deutschland, Frankreich, Belgien und Portugal zulegen. Insgesamt kommt die ID damit auf 89 Sitze (+⁠13) und überholt erstmals die Liberalen als drittstärkste Fraktion im Parlament. Im dynamischen Szenario, das unter anderem auch von einem ID-Beitritt der ungarischen Regierungspartei Fidesz ausgeht, fällt der Zugewinn sogar noch deutlicher aus. Hier würde die ID 108 Sitze erreichen, fast doppelt so viele wie im aktuellen Parlament.

Mit diesem Aufschwung lässt die ID auch die andere Rechtsfraktion im Europäischen Parlament, die EKR, weit hinter sich. Diese schnitt zuletzt in Polen und Rumänien schwächer ab als zuvor und kommt deshalb nur noch auf 75 Sitze (–⁠3, dynamisches Szenario: 85). Auch das wäre allerdings immer noch ein enormer Zuwachs gegenüber dem aktuellen Parlament.

Fraktionslose und Sonstige

Auch die (großteils rechtsgerichteten) fraktionslosen Parteien können in der aktuellen Projektion dazugewinnen – etwa die ungarische Fidesz und die französische Reconquête. Auch die neofaschistische Republika aus der Slowakei und die populistische DP aus Litauen würden nun wieder ein Mandat im Parlament gewinnen. Insgesamt erreichen die Fraktionslosen damit im Basisszenario 43 Sitze (+⁠5). Im dynamischen Szenario, das unter anderem Fidesz der ID- und Reconquête der EKR-Fraktion zurechnet, sind es hingegen nur 34 Sitze.

Hinzu kommen schließlich noch die „sonstigen“ Parteien, die derzeit nicht im Parlament vertreten sind und keiner Fraktion eindeutig zugeordnet werden können. Hier konnten etwa die Rechtsaußenparteien Konfederacja aus Polen und DD aus Dänemark zuletzt dazugewinnen; auch die litauische Mitte-links-Partei LRP sowie die der EKR-Fraktion zugeneigte ITN aus Bulgarien würden nun wieder einen Sitz erreichen. Neu im Tableau ist zudem die neofaschistische ELAM aus Zypern. Für das neu gegründete BSW aus Deutschland gibt es noch keine seriösen Umfragewerte, sodass es auch in der Projektion noch nicht berücksichtigt ist.

Mehrere andere Parteien, etwa die niederländischen NSC und BBB, die bulgarische PP und die slowakische Hlas, schneiden hingegen schlechter ab als im November. Insgesamt kommen die sonstigen Parteien damit im Basisszenario auf 30 Sitze (–⁠6). Im dynamischen Szenario sind alle Sonstigen einer der bestehenden Fraktionen zugeordnet.

Mitte-links ohne Mehrheit – Mitte-rechts auch

Die Schwäche der Mitte-links-Parteien und der Aufstieg der Rechten hat auch Auswirkungen auf Optionen für die Mehrheitsbildung im Europäischen Parlament und für die EU-Institutionen insgesamt. Wie schon anlässlich der letzten Projektion beschrieben, wäre das Mitte-links-Bündnis aus S&D, RE, G/EFA und Linke, das in der letzten Wahlperiode unter anderem in der Klimapolitik für wichtige Entscheidungen verantwortlich war, jetzt weit entfernt von einer eigenen Mehrheit (dynamisches Szenario: 316 von 720 Sitzen). Ohne Unterstützung einer beträchtlichen Anzahl von Abweichler:innen aus anderen Fraktionen und/oder fraktionslosen Abgeordneten könnten die Parteien links der EVP allein keine Beschlüsse mehr durchsetzen.

Das stärkt grundsätzlich die Verhandlungsposition der EVP bei der Mehrheitsbildung im Parlament. Allerdings hätte durch den Absturz der Liberalen und den Aufschwung der ID derzeit auch die wichtigste Bündnisoption rechts der Sozialdemokratie – eine Mitte-rechts-Allianz aus EVP, RE und EKR – derzeit keine eigene Mehrheit (dynamisches Szenario: 353 von 720 Sitzen). Ganz abgesehen davon, dass die Liberalen eine solche Allianz sehr skeptisch sehen und jedenfalls nicht formalisieren wollen.

Demokratische Mehrheiten gibt es nur mit der Großen Koalition

Eine rechte Mehrheit im Parlament gäbe es deshalb nur, wenn EVP und EKR auch mit der ID zusammenarbeiten (dynamisches Szenario: 370 von 720 Sitzen). Ansonsten bleibt als primäre Mehrheitsoption letztlich doch wieder nur die „ewige Große Koalition“ aus EVP, S&D und RE, die auch in der Vergangenheit stets die meisten Entscheidungen im Europäischen Parlament getragen hat (dynamisches Szenario: 411 von 720 Sitzen, einschließlich Grüne/EFA: 458 von 720 Sitzen).

Nach der Wahl wird es also vor allem auf die EVP ankommen: Wird sie dem europäischen Rechtsruck folgen und die „Brandmauer“ einreißen, mit der sich die demokratischen Parteien bisher von der Rechtsaußenfraktion abgegrenzt haben? Oder bleibt sie in der demokratischen Mitte und bindet sich noch enger an Sozialdemokrat:innen und Liberale? In letzterem Fall könnte die Stärke der Rechten EVP und S&D sogar noch enger zusammenschweißen als bisher, weil beide Fraktionen wissen, dass sie ohneeinander im Parlament keine demokratischen Mehrheiten bilden können.

Immerhin: Solange die EVP will, wird es den demokratischen Parteien auch in der nächsten Wahlperiode zuverlässig möglich sein, die rechtsextremen Parteien zu überstimmen und von der Macht fernzuhalten. Die gemeinsame Sitzzahl der „ewigen Großen Koalition“ sinkt zwar auf ein historisches Minimum, wird aber weiter für eine solide Mehrheit genügen. Die Brandmauer ist nur eine Frage des politischen Willens – wenigstens im Europäischen Parlament.

Keine Brandmauer im Rat

Anders sieht hingegen die Situation im Rat der EU aus, der ja in allen europäischen Entscheidungsprozessen mit dem Parlament mindestens gleichgestellt ist. Im Rat fallen wichtige Entscheidungen entweder einstimmig oder mit qualifizierter Mehrheit (also durch Zustimmung von mindestens 55% der Regierungen, die zugleich mindestens 65% der europäischen Bevölkerung repräsentieren).

Eine Sperrminorität ist also erreicht, wenn eine Partei in mindestens 13 Mitgliedstaaten mitregiert – oder in Ländern, die mindestens 35% der EU-Bevölkerung ausmachen. Davon sind die rechten Parteien zwar noch ein Stück entfernt: Derzeit sind EKR-Mitgliedsparteien an den Regierungen in Italien (FdI), Tschechien (ODS) und Finnland (PS) beteiligt. Die ID hat Minister:innen in Italien (Lega); hinzu kommen noch der ID nahestehende Regierungsparteien in Ungarn (Fidesz) und der Slowakei (SNS). Im Ganzen sind Rechtsaußenparteien in der EU also an fünf Regierungen beteiligt, die etwas über 20% der Bevölkerung repräsentieren.

Allerdings stimmt der Rat in der Praxis nicht entlang von Parteilinien ab, sondern sucht einen größtmöglichen Konsens zwischen den Mitgliedstaaten. Eine auch nur halbwegs stabile Brandmauer gegen Rechtsaußenregierungen gibt es hier nicht. Schon jetzt üben rechte Parteien deshalb über den Rat größeren Einfluss auf die Europapolitik aus als über das Parlament. Wenn in den nächsten Monaten noch weitere Regierungen mit ID-Beteiligung hinzukommen – etwa in den Niederlanden (PVV) oder in Österreich (FPÖ) –, wird sich diese Entwicklung noch weiter verstärken.

Konsensverfahren als Einfallstor

Europa ist dabei, nach rechts zu kippen: Das wird die Öffentlichkeit 2024 vor allem anhand der Europawahl diskutieren, bei der EKR und ID mit starken Zugewinnen rechnen können. Doch bei aller Aufregung sollte nicht vergessen werden, dass das Parlament mit seinen demokratischen Mehrheitsverfahren tatsächlich diejenige EU-Institution ist, die am besten gegen den Ansturm von Rechtsaußen gewappnet ist.

Das eigentliche europapolitische Einfallstor rechtsextremer Parteien ist hingegen der Rat, wo sie schleichend, von einer nationalen Regierungsbeteiligung zur nächsten, ihre Machtposition ausbauen können. Nicht die supranationale Demokratie, sondern die „souveränitätsschonenden“ Konsensverfahren führen dazu, dass Rechtsaußenparteien konkreten Einfluss auf die europäische Gesetzgebung gewinnen, obwohl eine große Mehrheit der europäischen Bürger:innen nach wie vor die demokratische Mitte unterstützt.

Die Übersicht

Die folgende Tabelle schlüsselt die Sitzverteilung der Projektion nach nationalen Einzelparteien auf. Die Tabelle folgt dem Basisszenario, in dem die nationalen Parteien jeweils ihrer aktuellen Fraktion (bzw. der Fraktion ihrer europäischen Dachpartei) zugeordnet sind. Parteien, die weder im Parlament vertreten sind noch einer europäischen Partei angehören, verbleiben in der Spalte „Sonstige“.

Das dynamische Szenario der Sitzprojektion baut auf dem Basisszenario auf, ordnet jedoch auch alle „sonstigen Parteien“ jeweils den Fraktionen zu, denen diese plausiblerweise am nächsten stehen. Zudem bezieht das dynamische Szenario auch mögliche künftige Fraktionswechsel einzelner nationaler Parteien ein, die schon jetzt im Parlament vertreten sind. In der Tabelle sind die Veränderungen im dynamischen Szenario gegenüber dem Basisszenario durch farbige Schrift und durch Hinweise im Mouseover-Text gekennzeichnet.

Da es keine gesamteuropäischen Wahlumfragen gibt, basiert die Projektion auf aggregierten nationalen Umfragen und Wahlergebnissen aus allen Mitgliedstaaten. Wie die Datengrundlage für die Länder im Einzelnen aussieht, ist im Kleingedruckten unter den Tabellen erläutert. Mehr Informationen zu den europäischen Parteien und zu den Fraktionen im Europäischen Parlament gibt es hier.


Linke G/EFA S&D RE EVP EKR ID fʼlos Sonst.
EP heute3871141101178675851
Nov. 2343431379017078763845
Jan. 2433451418616975894339
dynamisch3547143911778510834

Linke G/EFA S&D RE EVP EKR ID fʼlos Sonst.
DE 3 Linke 12 Grüne
1 Piraten
1 ÖDP
1 Volt
14 SPD 5 FDP
3 FW
30 Union
1 Familie

22 AfD 2 Partei 1 Tier
FR 6 LFI
7 EELV 9 PS 18 Ens 8 LR
27 RN 6 Rec

IT

16 PD 6 Az-+EU 6 FI
1 SVP
25 FdI 8 Lega 14 M5S
ES 2 Sumar
1 Podemos
1 Bildu
4 Sumar
1 ERC
20 PSOE
24 PP 7 Vox
1 Junts

PL

5 Lewica 3 PL2050
18 KO
2 KP
20 PiS

5 Konf
RO

14 PSD 6 USR 7 PNL
2 UDMR
4 AUR


NL
3 GL 3 PvdA 4 VVD
2 D66


12 PVV
5 NSC
2 BBB
BE 2 PTB 1 Groen
1 Ecolo
2 Vooruit
3 PS
1 O-VLD
2 MR
1 CD&V
1 LE
1 CSP
3 N-VA 4 VB

CZ
3 Piráti

9 ANO 1 STAN
1 TOP09
4 ODS 3 SPD

EL 3 Syriza
3 PASOK
9 ND 1 EL
2 KKE 1 PE
1 NIKI
1 Spart
HU

5 DK
1 MSZP
2 MM 1 KDNP

12 Fidesz
PT 2 BE

8 PS 1 IL 6 PSD
4 CH

SE 2 V 1 MP 9 S
4 M 5 SD


AT
2 Grüne 5 SPÖ 2 Neos 4 ÖVP
7 FPÖ

BG

2 BSP 3 DPS 5 GERB


3 PP-DB
3 V
1 ITN
DK 1 Enhl. 3 SF 4 S 1 V
2 LA
1 M
1 K


2 DD
SK


3 PS 1 OĽANO
1 D
1 KDH
1 SASKA
4 Smer
1 REP
2 Hlas
1 SNS
FI 1 Vas 1 Vihreät 4 SDP 2 Kesk 4 Kok 3 PS


IE 6 SF

3 FF 4 FG


1 SD
HR

3 SDP
6 HDZ


1 Možemo
1 Most
1 DP
LT
2 LVŽS 3 LSDP 1 LRLS
2 TS-LKD

1 DP 1 DSVL
1 LRP
LV
1 Prog


2 JV
2 NA

2 ZZS
1 LRA
1 S!
SI 1 Levica
1 SD 3 GS 4 SDS


EE

1 SDE 1 RE
1 KE
2 Isamaa
2 EKRE

CY 2 AKEL
1 DIKO

2 DISY


1 ELAM
LU

2 LSAP 1 DP 3 CSV


MT

3 PL
3 PN


Verlauf (Basisszenario)


Linke G/EFA S&D RE EVP EKR ID fʼlos Sonst.
08.01.2024 33 45 141 86 169 75 89 43 39
06.11.2023 43 43 137 90 170 78 76 38 45
11.09.2023 42+1 46 144+3 90+1 157+5 77 72+2 36+1 41+2
17.07.2023 41 48 136 94 160 79 70 36 41
22.05.2023 49 50 137 92 162 79 67 33 36
27.03.2023 44 42 137 94 162 78 68 38 42
01.02.2023 50 42 135 96 168 78 65 37 34
06.12.2022 51 44 136 93 166 79 64 37 35
12.10.2022 52 42 127 100 169 79 63 35 38
20.08.2022 52 47 134 98 170 75 63 27 39
22.06.2022 54 44 133 101 165 77 64 31 36
25.04.2022 59 39 139 97 157 78 64 38 34
01.03.2022 53 36 139 98 158 78 62 45 36
04.01.2022 51 39 142 99 165 73 62 34 40
08.11.2021 50 42 144 96 155 75 72 36 35
13.09.2021 54 42 141 98 160 70 75 33 32
21.07.2021 52 45 133 97 167 71 74 31 35
24.05.2021 50 50 125 95 167 74 73 33 38
29.03.2021 52 46 136 96 164 71 73 34 33
02.02.2021 52 45 135 94 184 70 71 21 33
09.12.2020 52 47 136 93 188 67 73 20 29
12.10.2020 51 49 127 96 193 67 71 21 30
14.08.2020 50 53 145 88 196 65 64 20 24
25.06.2020 48 55 143 91 203 64 63 20 18
26.04.2020 47 53 151 88 202 66 66 19 13
10.03.2020 51 58 138 88 188 67 82 21 12
09.01.2020 49 58 135 93 186 65 82 24 13
23.11.2019 48 57 138 99 181 62 82 22 16
23.09.2019 49 61 139 108 175 56 82 24 11
30.07.2019 47 64 138 108 180 57 82 22 7
Wahl 2019 40 68 148 97 187 62 76 27

Die Zeile „Wahl 2019“ kennzeichnet die Sitzverteilung zum 2. Juli 2019, dem Zeitpunkt der Konstituierung des Europäischen Parlaments nach der Europawahl im Mai 2019.
Angegeben sind jeweils die Werte im Basisszenario ohne das Vereinigte Königreich. Bis September 2023 basiert die Sitzprojektion auf 705 Sitzen, danach auf 720 Sitzen. Bei den Angaben für September 2023 ist der Übergang durch hochgestellte Zahlen markiert.
Eine Übersicht der Werte mit dem Vereinigten Königreich für die Zeit bis Januar 2020 ist hier zu finden. Eine Übersicht älterer Projektionen aus der Wahlperiode 2014-2019 gibt es hier.

Die vollen Namen der Fraktionen und der nationalen Einzelparteien erscheinen als Mouseover-Text, wenn der Mauszeiger eine kurze Zeit regungslos auf der Bezeichnung in der Tabelle gehalten wird. Sofern eine Partei im dynamischen Szenario einer anderen Fraktion zugeordnet ist als im Basisszenario, ist dies ebenfalls im Mouseover-Text gekennzeichnet.

Fraktionszuordnung

Basisszenario: Für die Projektion werden Parteien, die bereits im Europäischen Parlament vertreten sind, jeweils ihrer derzeitigen Fraktion zugerechnet, es sei denn, sie haben ausdrücklich ihren Entschluss zu einem Fraktionswechsel nach der nächsten Europawahl erklärt. Nationale Parteien, die derzeit nicht im Europäischen Parlament vertreten sind, aber einer europäischen Partei angehören, werden der Fraktion der entsprechenden europäischen Partei zugeordnet. In Fällen, bei denen sich die Mitglieder einer nationalen Liste nach der Wahl voraussichtlich auf mehrere Fraktionen aufteilen werden, wird jeweils die am plausibelsten scheinende Verteilung zugrundegelegt. Parteien, bei denen die Zuordnung zu einer bestimmten Fraktion unklar ist, werden im Basisszenario als „Sonstige“ eingeordnet.

Für die Bildung einer eigenständigen Fraktion sind nach der Geschäftsordnung des Europäischen Parlaments mindestens 23 Abgeordnete aus mindestens einem Viertel der Mitgliedstaaten erforderlich. Gruppierungen, die diese Bedingungen nach der Projektion derzeit nicht erfüllen würde, sind mit einem Asterisk (*) gekennzeichnet. Sie müssten gegebenenfalls nach der Europawahl zusätzliche Abgeordnete für sich gewinnen, um sich als Fraktion konstituieren zu können.

Dynamisches Szenario: Im dynamischen Szenario werden alle „sonstigen“ Parteien einer schon bestehenden Fraktion (oder der Gruppe der Fraktionslosen) zugeordnet. Außerdem werden gegebenenfalls Fraktionsübertritte von bereits im Parlament vertretenen Parteien berücksichtigt, die politisch plausibel erscheinen, auch wenn sie noch nicht öffentlich angekündigt wurden. Um diese Veränderungen gegenüber dem Basisszenario deutlich zu machen, sind Parteien, die im dynamischen Szenario einer anderen Fraktion zugeordnet werden, in der Tabelle mit der Farbe dieser Fraktion gekennzeichnet; zudem erscheint der Name der möglichen künftigen Fraktion im Mouseover-Text. Die Zuordnungen im dynamischen Szenario basieren teils auf einer subjektiven Einschätzung der politischen Ausrichtung und Strategie der Parteien und können daher im Einzelnen recht unsicher sein. In der Gesamtschau kann das dynamische Szenario jedoch näher an der wirklichen Sitzverteilung nach der nächsten Europawahl liegen als das Basisszenario.

Datengrundlage

Soweit verfügbar, wird bei der Sitzberechnung für jedes Land jeweils die jüngste Umfrage zu den Wahlabsichten für das Europäische Parlament herangezogen. Wo mehr als eine Umfrage erschienen ist, wird der Durchschnitt aller Umfragen aus den letzten zwei Wochen vor der jüngsten Umfrage berechnet, wobei jedoch von jedem einzelnen Umfrageinstitut nur die jeweils letzte Umfrage berücksichtigt wird. Stichtag für die Berücksichtigung einer Umfrage ist, soweit bekannt, jeweils der letzte Tag der Durchführung, andernfalls der Tag der Veröffentlichung.
Für Länder, in denen es keine spezifischen Europawahlumfragen gibt oder die letzte solche Umfrage mehr als zwei Wochen zurückliegt, wird stattdessen die jüngste verfügbare Umfrage für die Wahl zum nationalen Parlament bzw. der Durchschnitt aller Umfragen für das nationale oder das Europäische Parlament aus den letzten zwei Wochen vor der jüngsten verfügbaren Umfrage verwendet. Für Länder, in denen es keine aktuellen Umfragen für Parlamentswahlen gibt, wird stattdessen gegebenenfalls auf Umfragen zu Präsidentschaftswahlen zurückgegriffen, wobei die Umfragewerte der Präsidentschaftskandidat:innen jeweils den Parteien der Kandidat:innen zugeordnet werden (dies kann insbesondere Frankreich und Zypern betreffen). Für Mitgliedstaaten, für die sich überhaupt keine Umfragen finden lassen, wird auf die Ergebnisse der letzten nationalen Parlaments- oder Europawahl zurückgegriffen.
In der Regel werden die nationalen Umfragewerte der Parteien direkt auf die Gesamtzahl der Sitze des Landes umgerechnet. Für Länder, in denen die Wahl in regionalen Wahlkreisen ohne Verhältnisausgleich erfolgt (aktuell Belgien und Irland), werden regionale Umfragedaten genutzt, soweit diese verfügbar sind. Wo dies nicht der Fall ist, wird die Sitzzahl für jeden Wahlkreis einzeln berechnet, dabei aber jeweils die nationalen Gesamt-Umfragewerte herangezogen. Nationale Sperrklauseln werden, soweit vorhanden, in der Projektion berücksichtigt.
In Belgien entsprechen die Wahlkreise bei der Europawahl den Sprachgemeinschaft, während Umfragen üblicherweise auf Ebene der Regionen durchgeführt werden. Für die Projektion werden für die französischsprachige Gemeinschaft die Umfragedaten aus Wallonien, für die niederländischsprachige Gemeinschaft die Umfragedaten aus Flandern genutzt. Für die deutschsprachige Gemeinschaft wird das Ergebnis der letzten Europawahl herangezogen (1 Sitz für CSP).
In Ländern, in denen es üblich ist, dass mehrere Parteien als Wahlbündnis auf einer gemeinsamen Liste antreten, werden der Projektion plausibel erscheinende Listengemeinschaften zugrunde gelegt. In der Tabelle sind diese in der Regel unter der Bezeichnung des Wahlbündnisses oder der größten dazugehörigen Partei zusammengefasst. Manchmal gehören die Parteien eines Wahlbündnisses im Europäischen Parlament jedoch unterschiedlichen Fraktionen an. In diesem Fall werden die Parteien einzeln aufgeführt und eine Plausibilitätsannahme über die Verteilung der Sitze auf der gemeinsamen Liste getroffen. Dies betrifft folgende Parteien: Italien: SI (1., 3. Listenplatz) und EV (2., 4.); Spanien: ERC (1., 3.-4.), Bildu (2.) und BNG (5.); PNV (1.) und CC (2.); Polen: PL2050 (1., 3., 5. etc.), KP (2., 4., 6. etc.); Niederlande: GL (1., 3., 5. etc.) und PvdA (2., 4., 6. etc.); Ungarn: Fidesz (1.-6., ab 8.) und KDNP (7.); Slowakei: PS (1.) und D (2.). In Tschechien treten ODS, TOP09 und KDU-ČSL zur Europawahl mit einer gemeinsamen Liste an, werden in nationalen Umfragen jedoch getrennt ausgewiesen Die Sitzprojektion weist deshalb jeder der drei Parteien die Sitzzahl zu, die sie einzeln erreichen würde, lässt jedoch die nationale Sperrklausel für sie außer Acht. In Spanien wird für die Mitglieder des Parteienbündnisses Sumar angenommen, dass sie sich zu zwei Dritteln der Fraktion Grüne/EFA, zu einem Drittel der Linksfraktion anschließen.
In Frankreich hatten sich für die nationale Parlamentswahl 2022 mehrere Mitte-links-Parteien (LFI, PS, EELV, PCF) zu dem Wahlbündnis NUPES zusammengeschlossen, das teilweise auch in späteren Umfragen noch vorkommt. Es ist jedoch eher unwahrscheinlich, dass dieses Bündnis auch bei der Europawahl in dieser Form Bestand hat. In der Projektion werden deshalb die Umfragewerte des Bündnisses jeweils auf die einzelnen Parteien aufgeteilt, und zwar entsprechend dem Verhältnis der durchschnittlichen Umfragewerte der Parteien in den letzten Umfragen, die diese einzeln ausweisen.
Da es in Deutschland bei der Europawahl keine Sperrklausel gibt, können Parteien bereits mit weniger als 1 Prozent der Stimmen einen Sitz im Europäischen Parlament gewinnen. Da deutsche Umfrageinstitute für Kleinparteien jedoch in der Regel keine Werte ausweisen, wird in der Projektion jeweils das Ergebnis der letzten Europawahl herangezogen (je 2 Sitze für PARTEI und FW, je 1 Sitz für Tierschutzpartei, ödp, Piraten, Volt und Familienpartei). Nur falls eine Kleinpartei in aktuellen Umfragen einen besseren Wert erreicht als bei der letzten Europawahl, wird stattdessen dieser Umfragewert genutzt.
In Italien können Minderheitenparteien durch eine Sonderregelung auch mit nur recht wenigen Stimmen ins Parlament einziehen. In der Projektion wird die Südtiroler Volkspartei deshalb stets mit dem Ergebnis der letzten Europawahl (1 Sitz) geführt.

Die folgende Übersicht führt die Datengrundlage für die Mitgliedstaaten im Einzelnen auf. Die Daten beziehen sich auf den letzten Tag der Durchführung; falls dieser nicht bekannt ist, auf den Tag der Veröffentlichung der Umfragen:
Deutschland: nationale Umfragen, 3.-6.1.2024, Quelle: Wikipedia.
Frankreich: Europawahl-Umfragen, 11.-14.12.2023, Quelle: Wikipedia.
Italien: nationale Umfragen, 2.-8.1.2024, Quelle: Wikipedia.
Spanien: nationale Umfragen, 26.12.2023-5.1.2024, Quelle: Wikipedia.
Polen: nationale Umfragen, 6.-17.12.2023, Quelle: Wikipedia.
Rumänien: nationale Umfragen, 28.12.2023, Quelle: Wikipedia.
Niederlande: nationale Umfragen, 11.-22.12.2023, Quelle: Wikipedia.
Belgien, niederländischsprachige Gemeinschaft: regionale Umfragen (Flandern) für die nationale Parlamentswahl, 28.11.-11.12.2023, Quelle: Wikipedia.
Belgien, französischsprachige Gemeinschaft: regionale Umfragen (Wallonien) für die nationale Parlamentswahl, 11.12.2023, Quelle: Wikipedia.
Belgien, deutschsprachige Gemeinschaft: Ergebnis der Europawahl, 26.5.2019.
Tschechien: nationale Umfragen, November 2023, Quelle: Wikipedia.
Griechenland: nationale Umfragen, 28.12.2023-5.1.2024, Quelle: Wikipedia.
Ungarn: nationale Umfragen, 15.12.2023, Quelle: Wikipedia.
Portugal: nationale Umfragen, 20.-23.12.2023, Quelle: Wikipedia.
Schweden: nationale Umfragen, 2.1.2024, Quelle: Wikipedia.
Österreich: nationale Umfragen, 21.-27.12.2023, Quelle: Wikipedia.
Bulgarien: nationale Umfragen, 13.12.2023, Quelle: Wikipedia.
Dänemark: nationale Umfragen, 13.-22.12.2023, Quelle: Wikipedia.
Slowakei: nationale Umfragen, 13.-18.12.2023, Quelle: Wikipedia.
Finnland: nationale Umfragen, 2.1.2024, Quelle: Wikipedia.
Irland: nationale Umfragen, 6.1.2024, Quelle: Wikipedia.
Kroatien: nationale Umfragen, 10.-22.12.2023, Quelle: Wikipedia.
Litauen: nationale Umfragen, 27.11.-2.12.2023, Quelle: Wikipedia.
Lettland: nationale Umfragen, Dezember 2023, Quelle: Wikipedia.
Slowenien: nationale Umfragen, 14.-21.12.2023, Quelle: Wikipedia.
Estland: nationale Umfragen, 13.-22.12.2023, Quelle: Wikipedia.
Zypern: nationale Umfragen, 22.9.2023, Quelle: Europe Elects.
Luxemburg: Ergebnisse der nationalen Parlamentswahl, 8.10.2023, Quelle: Wikipedia.
Malta: nationale Umfragen, 6.12.2023, Quelle: Wikipedia.

Bilder: alle Grafiken: Manuel Müller.
Korrekturhinweis, 12. Januar: Aufgrund eines Übertragungsfehlers enthielt eine frühere Fassung dieses Artikels in der Tabelle falsche Sitzzahlen für FI (Italien), SASKA und REP (beide Slowakei). Der Fehler wurde korrigiert.